Hooray! April's twenty-one sales were the most for any month since May 2015! The twenty-one sales are 50% more than in April 2017 and 38% more than the 5-year average for April. Thanks to April, the year to date (January 1 to April 30) number of sales of forty-eight is 7% more than the same period last year. Year to date sales still trail 2016 (-2%) and 2015 (-26%) but April's performance is definitely good to see. Meanwhile, prices continue upward. The average sale price was $1.3M, the 3rd month this year over $1M! (Seven of the last nine quarters have had average sales prices over $1M). April's Median price was $1.16M. April's average sale price per square foot hit $791, causing the year-to-date figure to climb to $760, well above End of Year 2017's figure of $724. Of note, eleven of the twenty-one sales were cash and ranged from $525,000 to $3,000,000.
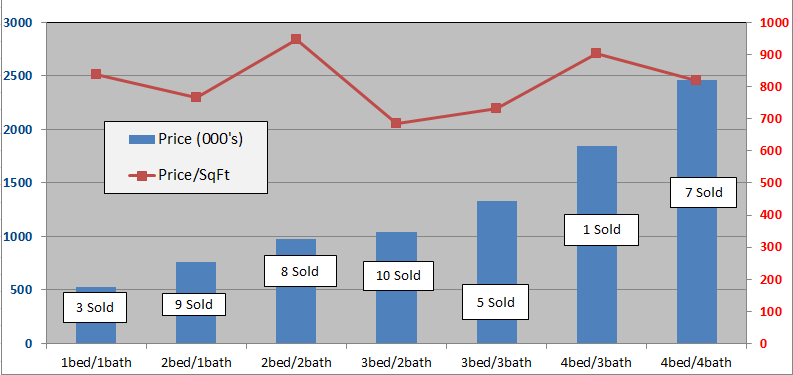
The below charts show sales of the seven most popular bed/bath combinations in Old Town Key West from January 1, 2008 to April 30, 2018. When there is a difference between total home sales and the sum of sales in the below seven charts it is because of a sale of, for instance, a 2bed/3bath or 3bed/1bath house or a house with more than four bedrooms.
These charts are for single family homes sold south and west of White St. and cover the six neighborhoods of The Meadows, Old Town North and South, Bahama Village, Truman Annex and Casa Marina but not Sunset Key. You can view a map of the six neighborhoods of Old Town here and an analysis of 2017 end-of-year sales, neighborhood by neighborhood, here.
The seven bed/bath combinations below contain enough sales to measure and evaluate trends after the 2004-2006 real estate Bubble.
_____________________________________________________________________________________
1 Bedroom/1 Bathroom
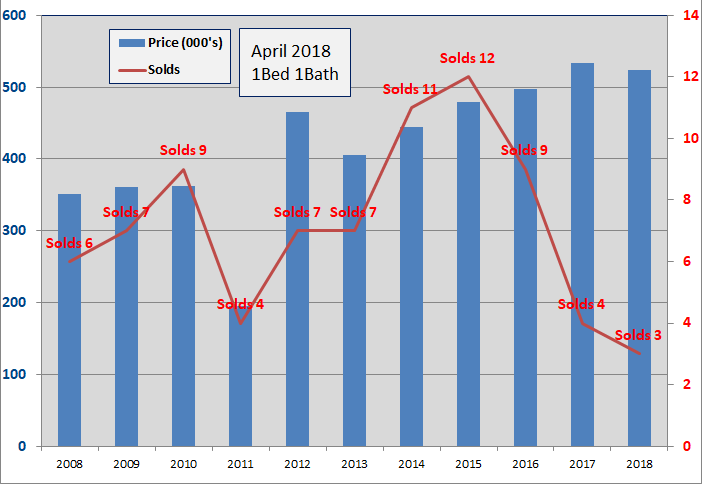
- Three, 1Bed/1Bath homes have sold in the Old Town area thru 4/30/2018. The average number of days to sell is 59 days.
- There are two 1/1 homes for sale at $599K and $1.595M.
- The 2018 average sale price of $523,000 is 2% below the average sale price for 2017.
- In 2015, twelve homes sold, the most since 2001. In 2016, 9 sold. In 2017 there were 4 sales.
- The average size of the 2018 homes sold is 625 sq.ft., about average; however, the average sale price per sqft. of $838 is 2% below 2017.
2 Bedrooms/1 Bathroom
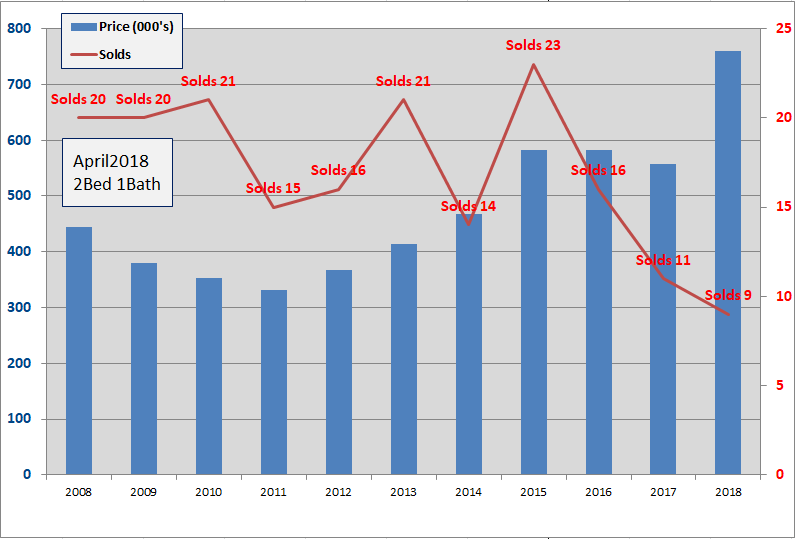
- Nine, 2Bed/1Bath homes have sold in the Old Town area thru 4/30/2018. The average number of days to sell is 107 days.
- The average Sold price of $760,000 is up 36% from 2017 which at $557K was down 4% from 2016.
- Six 2/1 homes are for sale with prices from $575K to $1.2M.
- Sixteen 2/1's sold in 2016, eleven in 2017.
- Since 2009, 2Bed/1Bath homes have been the 3rd most popular selling home in Old Town with 166 sales.
2 Bedrooms/2 Bathrooms
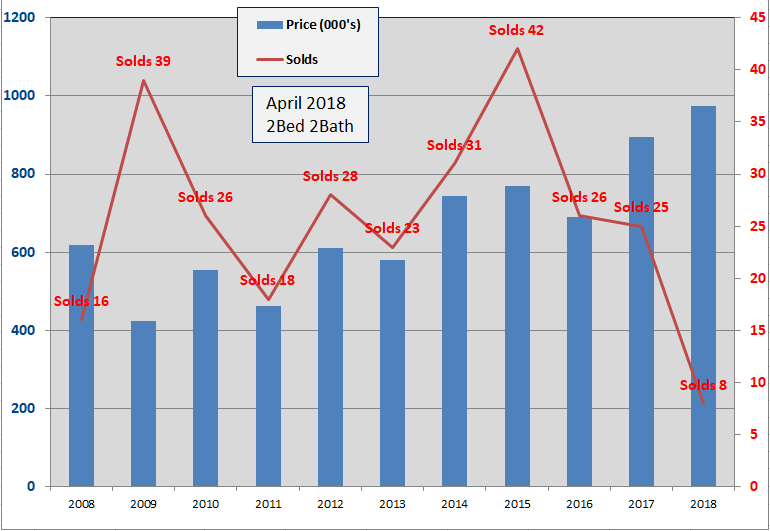
- Eight, 2Bed/2Bath homes have sold in the Old Town area thru 4/30/2018. The number of Days to sell is 99 Days, same as in 2017.
- The average sold price of $974,000 is up 9% from 2017 and is 129% above the low in 2009.
- Eighteen 2/2's are for sale, priced between $599,000 and $1.68M.
- The average Sold price per sqft for 2018 is $948. In 2017 the average was $704, in 2016 the average was $614.
- Since 2009, 2Bed/2Bath homes have been the biggest sellers in Old Town Key West with 266 sales.
3 Bedrooms/2 Bathrooms
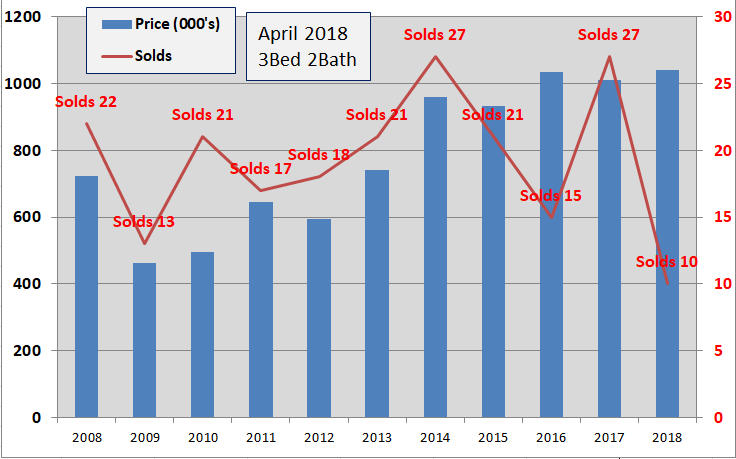
- Ten, 3Bed/2Bath homes have sold in the Old Town area thru 4/30/2018. The number of Days to sell is 154 Days.
- The average Sold price of $1,040,000 is up 3% from 2017 which was 2% below 2016 and is 126% above the 2009 low.
- The average sold price per sqft. is $684, up 1% over 2017.
- Twenty-one 3/2's sold in 2015, fifteen in 2016 and twenty-seven in 2017.
- Since 2009, 3Bed/2Bath homes have been the 2nd biggest sellers in Old Town with 190 sales.
3 Bedrooms/3 Bathrooms
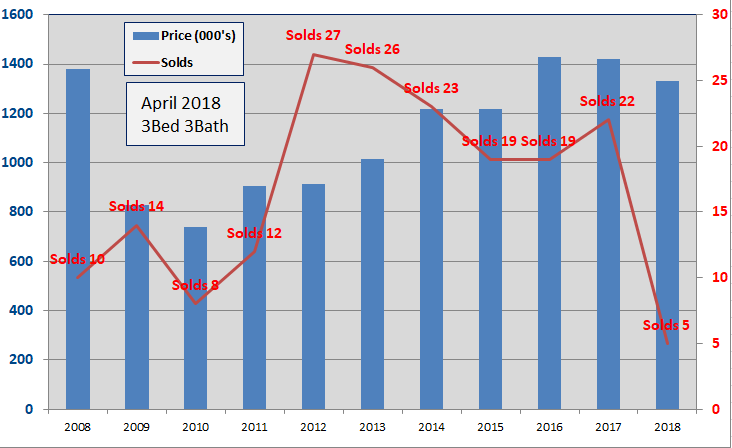
- Five, 3Bed/3Bath homes have sold in the Old Town area thru 4/30/2018. The average number of Days to sell is 233 Days.
- The average sold price of $1.33M is down 6% from 2017 which was 1% below 2016.
- The average Sold price per sqft. of $732 is down 9% from 2017. 2017's $806 was the highest since 2005.
- Nineteen homes sold in both 2015 and 2016 with twenty-two sales in 2017.
- Since 2009, 3Bed/3Bath homes have been the fourth biggest seller in Old Town Key West
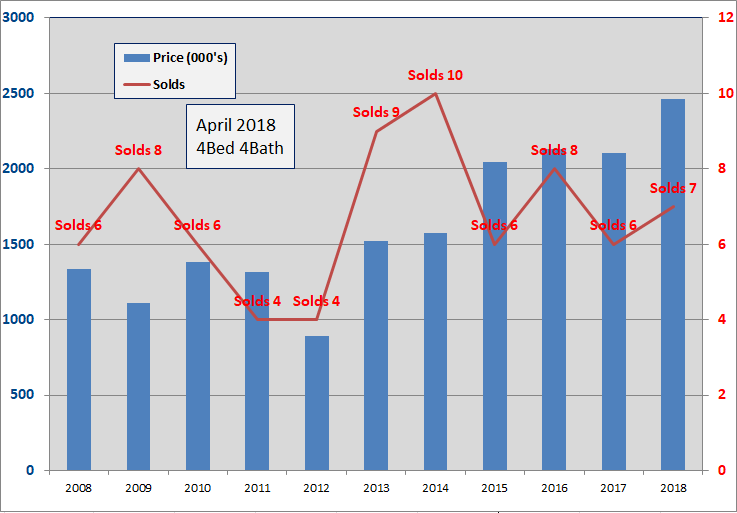
4 Bedrooms/3 Bathrooms

- One, 4Bed/3Bath home has sold in the Old Town area thru 4/30/2018. Days to sell is 32 days. In 2017, the average number of Days to sell was 51 days.
- The home sold for $1.845. In 2017 the average sale price of $1.488M was 27% below 2016 with the 5-year average sales price of $1.525M.
- There are 10 homes for sale ranging in price from $1.125M to $3.75M.
- Number of sales and sales prices for 4Bed/3Bath homes is very choppy though there has been an upward trend in average sale price since 2013.
4 Bedrooms/4 Bathrooms
- Seven, 4Bed/4Bath homes have sold in the Old Town area thru 4/30/2018. The average number of Days to sell is 132 days.
- There are eleven 4/4's for sale ranging from $1.68M to $6.2M.
- The average Sold price of $2.46M is up 17% from 2017 which was 1% below 2016.
- The average sold price per sq.ft. of $819 is 8% above 2017.
- Since 2003, average number of annual sales is six, with six in 2015, eight in 2016 and six in 2017.
- Year to year price action is choppy as a limited number of annual sales causes large fluctuations in average sales price.
Conclusion
Since 2013, the four month period of March thru June has comprised the buk of annual sales at 46%. For 2018; March lagged, April has boomed and May looks promising with 11 Pending and 4 Contingent. Prices are holding fast with the average sales price continuing to top $1M!
Nearly all the homes For Sale are in tip-top condition, leaving buyers with little more to do than minor tailoring to suit individual taste.
Sales have been below average since May 2017. So why the big buy in April?
Higher costs of borrowing causing mortgagees to pull the trigger?
- Interest rate hikes from the Federal Reserve and the likelihood of more? (Inverted yield curve, service of Fed debt, low jobless rate/wage growth, creeping inflation).
Reallocation of cash?
- Historically, new money in people's pocket goes to paying off debt, not more spending. Does this (and corporate debt service) threaten earnings and the stock market?
- More 'millionare" and "mass affluent" households determined to reward themselves after years of hard work.
- Post-tax season, buyers see the long term benefits, to them and their business, of the Tax Cut and Jobs Act making the Benefits of Buying in Cash a more feasible and positive contributor to their overall financial picture?
Regardless of the why's, May looks good, so let's keep our fingers crossed.
If you have any comments or questions, please contact me here.
Good luck!
Additional Resources: