For the 3rd month in a row, single family home sales in the Old Town area of Key West topped the 5-year average. Additionally, August's 16 sales were double the number of sales in August 2015. Single family home sales year to date trail 2015 by 14% but exceed the 5-year average by 13%. Prices too remain strong. Year to date average sale price per square foot of $724 exceeds the 5 year average by 35% and the August sale price per sqft of $764 was 28% above August 2015. Number of days to sell shows no real pattern though the 1bed/1bath and 2bed/1bath homes average under 100 days while the larger 4bedroom homes average over 225 days.
The below charts show sales of the seven most popular bed/bath combinations in Old Town Key West from January 1, 2006 to August 31, 2016.
These charts are for single family homes sold south and west of White St. and cover the neighborhoods of The Meadows, Old Town, Truman Annex and Casa Marina but not Sunset Key. You can view a neighborhood map here. The seven bed/bath combinations below contain enough sales to measure and evaluate trends after the 2004-2006 real estate Bubble.
The average sale price of $485,000 for 1bed/1bath homes is 149% above the 2009 low.
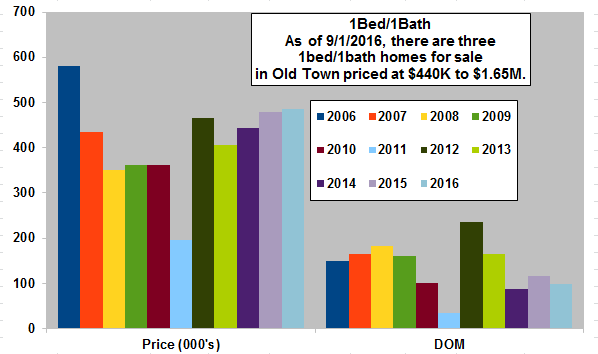
- Six, 1Bed/1Bath homes have sold in the Old Town area thru 8/31/2016. The average Days of Market was 98 days.
- The 2016 average sale price of $485,000 is 1% above the average sale price for 2015.
- In 2015, twelve 1/1 homes sold, the most since 2001.
- The average size of the 2016 Solds is 638 sq.ft., slightly smaller than 2015; however,
- The average sale price per sqft. is $760. This figure is 7% higher than 2015 and second highest since 2006.
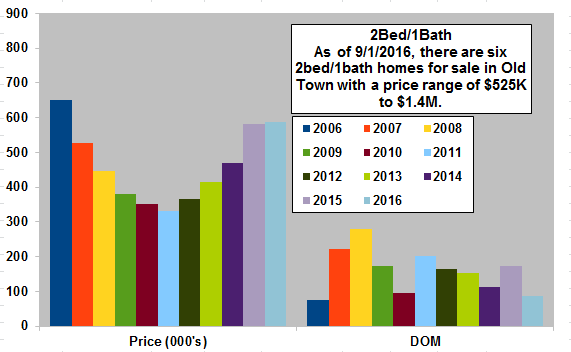
- Fifteen, 2Bed/1Bath homes have sold in the Old Town area thru 8/31/2016. The average Days on Market was 87 days.
- The aerage Sold price of $589,000 is 1% above 2015 which was 25% more than 2014.
- Six 2/1 homes are for sale with prices from $525K to $1.45M.
- Fifteen 2/1 homes sold in 2011, sixteen in 2012 and twenty-one in 2013 but only fourteen in 2014 so twenty-three sales for 2015 was very encouraging.
- Since 2009, 2Bed/1Bath homes have been the 3rd most popular selling home in Old Town.
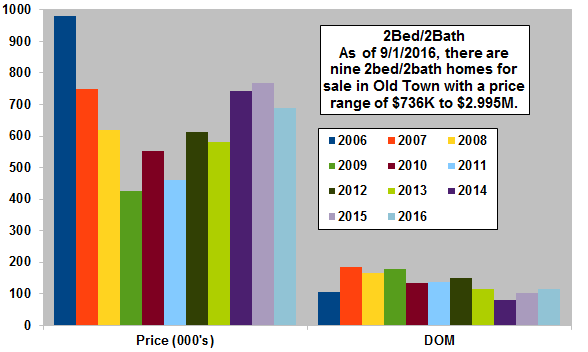
- Twenty-three, 2Bed/2Bath homes have sold in the Old Town area thru 8/31/2016. The average Days on Market was 114 Days.
- The average sold price of $690,000 is 18% below 2015 and only 62% above the low in 2009.
- Nine 2/2's are for sale, priced between $736,000 and $2.995M.
- Average Sold price per sqft in 2016 is $606, 9% below 2015 which was 15% more than 2014.
- Since 2009, 2Bed/2Bath homes have been the biggest sellers in Old Town Key West with 230 sales.
The average sale price of $1,015,000 for 3bed/2bath homes is 120% above the low in 2009.
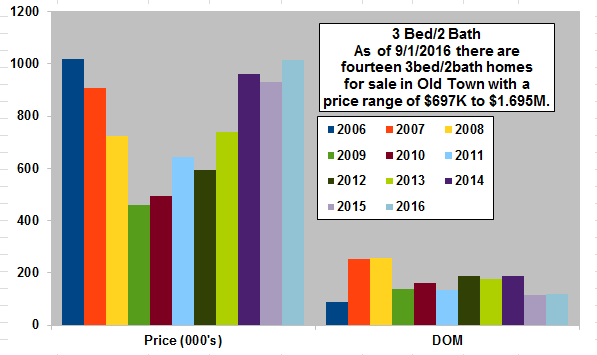
- Ten, 3Bed/2Bath homes have sold in the Old Town area thru 8/31/2016. The average Days on Market was 120 Days.
- The average Sold price of $1.015,000 is 9% above 2015, which was 3% below 2014, and is 120% above the 2009 low.
- Average sold price per sqft. is $707, up 14% from 2015, primarily because the ten homes sold are the smallest 3/2 homes sold since 2012.
- Twenty-seven 3/2's sold in 2014 and twenty-one sold in 2015.
- Since 2009, 3Bed/2Bath homes have been the 2nd biggest sellers in Old Town as value buyers take advantage of comparatively large homes at low prices.
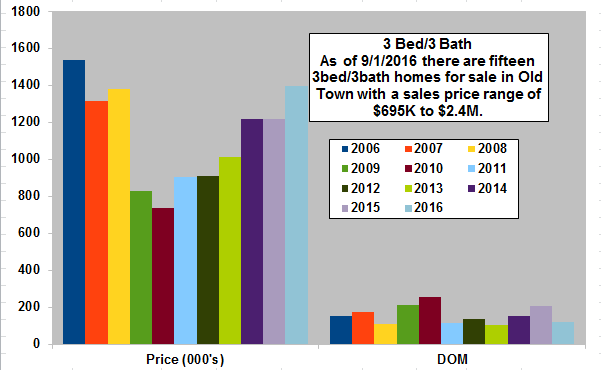
- Fifteen, 3Bed/3Bath homes have sold in the Old Town area thru 8/31/2016. The average Days on Market was 120 Days.
- The average sold price of $1.396M is 15% above 2015 and 89% above the 2010 low.
- The average size of the fifteen sold is 1841 sq.ft., about average; yet, the average Sold price per sqft. of $758 is the highest since 2008.
- Twenty-three 3/3's sold in 2014 and nineteen in 2015.
- Since 2009, 3Bed/3Bath homes have been the fourth biggest seller in Old Town Key West.
The average sale price of $2.163 for 4bed/3bath homes is 156% above the 2009 low.
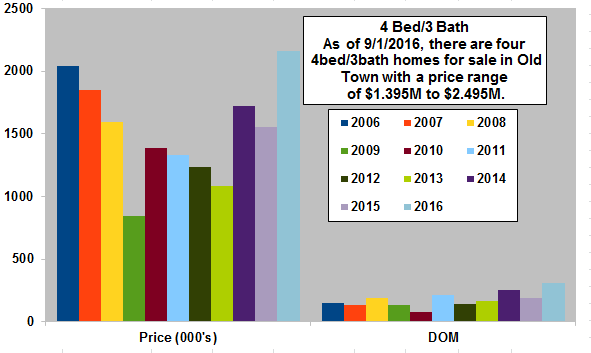
- Twelve, 4Bed/3Bath homes have sold in the Old Town area thru 8/31/2016. The average Days of Market was 309 Days.
- The 2016 average sale price of $2.163M is 3944% above 2015 which was 10% below the 2014 average sold price. $2.163M is 156% above the 2009 low.
- Average Sold price per sq.ft. is $903 is the highest since 2005.
- The average size of the seven sold is 2396 sq.ft., large beautiful homes.
- This Bed/Bath configuration has finally solidified its price reversal. Plus, the twelve sales in 2012, the highest since 2008, and seven sales in 2015, with a climbing average sales price per square foot, shows strength.
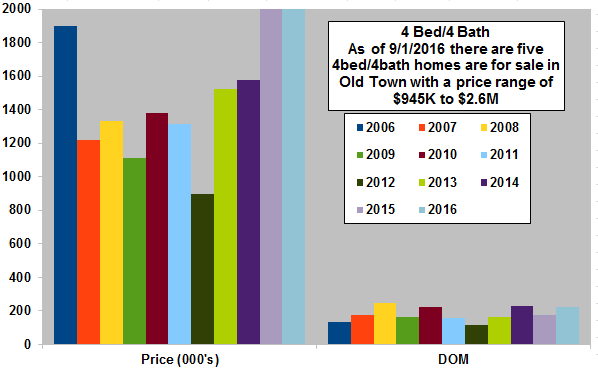
- Eight, 4Bed/4Bath homes have sold in the Old Town area thru 8/31/2016. The average Days on Market was 225 Days.
- The average Sold price of $2.132M is 4% above the 2015 average Sold price which was 30% above 2014 and in the highest recorded. The $2.132M is 92% above the 2009 low.
- The 2016 average sold price per sq.ft. of $815 is 9% above the 2015 average sold price per sqft which was 24% above 2014.
- Since 2003, average number of annual sales is six, with nine sold in 2013, ten in 2014 and six in 2015.
- Year to year price action is choppy as a limited number of annual sales causes large fluctuations in average sales price.
Summary

It looks like number of sales have finally turned a corner. Each of the 4th Quarter 2015 and the 1st and 2nd Quarter 2016 had fewer number of sales than their respective Quarter in the preceeding year - by 27%, 33% and 26%. Though average sale prices and sale price per square foot moved higher, falling number of sales raised the spectre of a bubble or at least a leveling off of the steady recovery from the 2009 - 2010 lows.
The shrinking number of sales yet higher prices prompted debate about the affordability factor. Yet, the Median Price for August's 16 sales was $889,000 with eight sales below, as low as $271,000, and eight sales above, as high as $2,295,000.
Buyers obviously remain confident in the Key West housing market, whether the sale was cash or mortgage.
Of note, September, October and November are historically the slowest months of the year with each month registering a 5 year average of less than 10 closings.
If you have any comments or questions, please contact me here.
Good luck!
Additional information: