
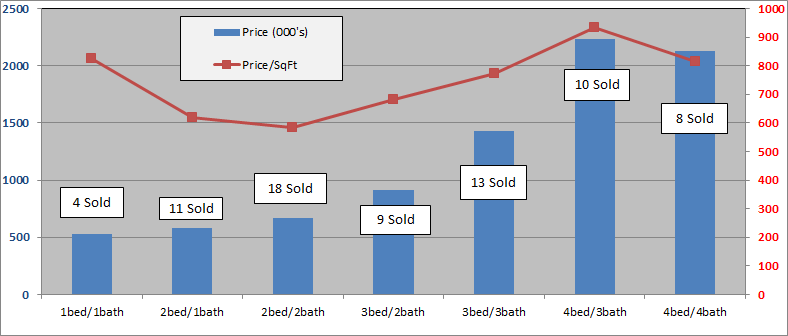
For the 2nd month in a row, Old Town sales of single family homes topped the 5-Yr average. June had 19 sales and July had 14 sales; yet, number of sales for the year trail the 5-Yr average by 5% and the number of sales Jan - July 2015 by 27%. While 2bed/2bath homes maintain their historic position of most homes sold (See Summary below), it's larger homes with 3 and 4 bedrooms and bathrooms that are driving sales. Average sale prices and sale prices per square feet continue high. The average sale price per sq.ft. for July was $842, the 2nd month this year over $800, with 1bed/1bath, 4bed/3bath and 4bed/4bath each over $800 per sq.ft.
The below charts show sales of the seven most popular bed/bath combinations in Old Town Key West from January 1, 2006 to July 31, 2016.
These charts are for single family homes sold south and west of White St. and cover the neighborhoods of The Meadows, Old Town, Truman Annex and Casa Marina but not Sunset Key. You can view a neighborhood map here. The seven bed/bath combinations below contain enough sales to measure and evaluate trends after the 2004-2006 real estate Bubble.
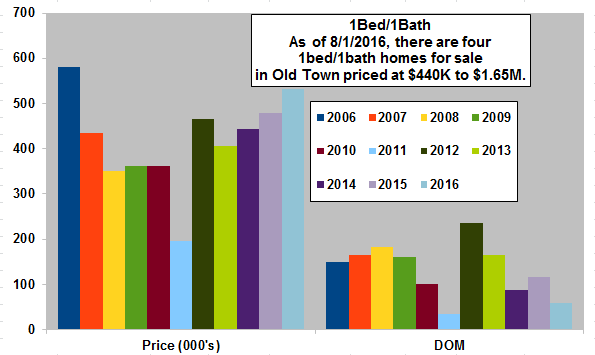
- Four, 1Bed/1Bath homes have sold in the Old Town area thru 7/31/2016. The average Days of Market was 61 days.
- The 2016 average sale price of $533,000 is 11% above the average sale price for 2015.
- In 2015, twelve 1/1 homes sold, the most since 2001.
- The average size of the 2016 Solds is 645 sq.ft., slightly smaller than 2015; however,
- The average sale price per sqft. is a remarkable $826. This figure is 16% higher than 2015 and highest since 2005.
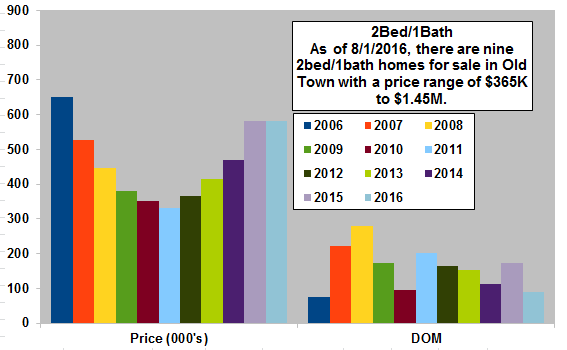
- Eleven, 2Bed/1Bath homes have sold in the Old Town area thru 7/31/2016. The average Days on Market was 90 days.
- Average Sold price of $582,000 is the same as 2015 which was 25% more than 2014.
- Nine 2/1 homes are for sale with prices from $365K to $1.45M.
- Fifteen 2/1 homes sold in 2011, sixteen in 2012 and twenty-one in 2013 but only fourteen in 2014 so twenty-three sales for 2015 was very encouraging.
- Since 2009, 2Bed/1Bath homes have been the 3rd most popular selling home in Old Town.
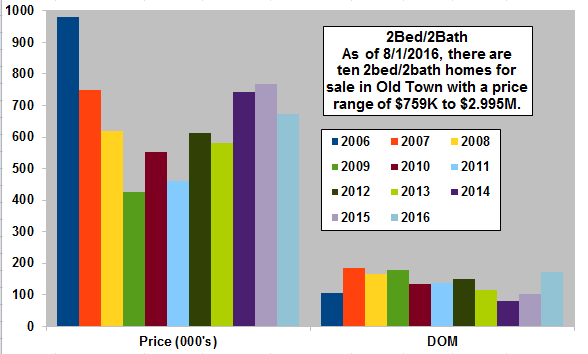
- Eighteen, 2Bed/2Bath homes have sold in the Old Town area thru 7/31/2016. The average Days on Market was 173 Days.
- The average sold price of $672,000 is 18% below 2015 and only 58% above the low in 2009.
- Ten 2/2's are for sale, priced between $759,000 and $2.995M.
- Average Sold price per sqft in 2016 is $583, 12% below 2015 which was 15% more than 2014.
- Since 2009, 2Bed/2Bath homes have been the biggest sellers in Old Town Key West with 221 sales.
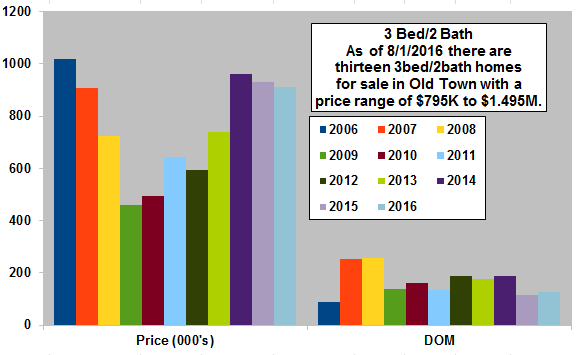
- Nine, 3Bed/2Bath homes have sold in the Old Town area thru 7/31/2016. The average Days on Market was 128 Days.
- The average Sold price of $913,000 is 2% below 2015, which was 3% below 2014, and is 98% above the 2009 low.
- Average sold price per sqft. is $681, up 9% from 2015, primarily because the nine homes sold are the smallest 3/2 homes sold since 2005.
- Twenty-seven 3/2's sold in 2014 and twenty-one sold in 2015.
- Since 2009, 3Bed/2Bath homes have been the second biggest sellers in Old Town Key West as value buyers took advantage of comparatively large homes at low prices.

- Thirteen, 3Bed/3Bath homes have sold in the Old Town area thru 7/31/2016. The average Days on Market was 109 Days.
- The average sold price of $1.433M is 18% above 2015 and 94% above the 2010 low.
- The average size of the nine sold is 1858 sq.ft., about average; yet, the average Sold price per sqft. of $771 is the highest since 2008.
- Twenty-three 3/3's sold in 2014 and nineteen in 2015.
- Since 2009, 3Bed/3Bath homes have been the fourth biggest seller in Old Town Key West.
The average sales price of 4bed/3bath homes in old Town is 165% above the 2009 low.
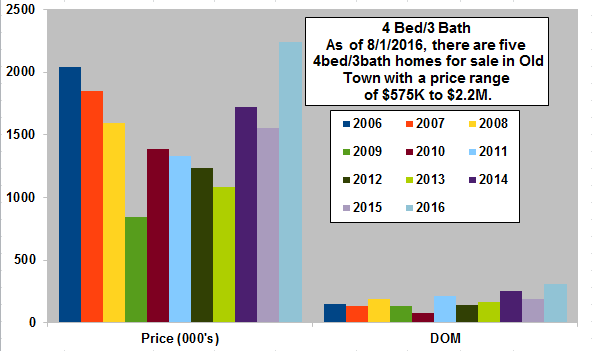
- Ten, 4Bed/3Bath homes have sold in the Old Town area thru 7/31/2016. The average Days of Market was 309 Days.
- The 2016 average sale price of $2.237M is 44% above 2015 which was 10% below the 2014 average sold price. $2.237M is 165% above the 2009 low.
- Average Sold price per sq.ft. is $935 is the highest since 2005.
- The average size of the seven sold is 2393 sq.ft., large beautiful homes.
- This Bed/Bath configuration has finally solidified its price reversal. Plus, the twelve sales in 2012, the highest since 2008, and seven sales in 2015, with a climbing average sales price per square foot, shows strength.
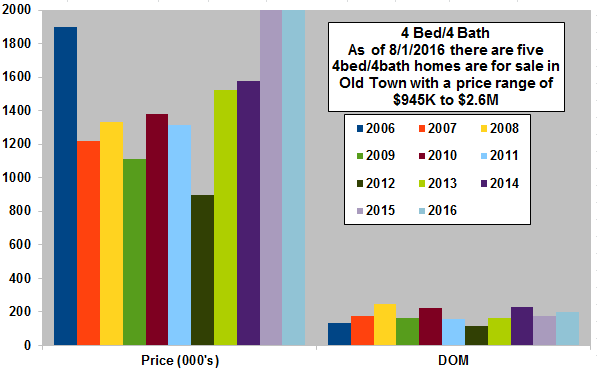
- Eight, 4Bed/4Bath homes have sold in the Old Town area thru 7/31/2016. The average Days on Market was 199 Days.
- The average Sold price of $2.132M is 4% above the 2015 average Sold price which was 30% above 2014 and in the highest recorded. The $2.132M is 92% above the 2009 low.
- The 2016 average sold price per sq.ft. of $815 is 9% above the 2015 average sold price per sqft which was 24% above 2014.
- Since 2003, average number of annual sales is six, with nine sold in 2013, ten in 2014 and six in 2015.
- Year to year price action is choppy as a limited number of annual sales causes large fluctuations in average sales price.
Summary
As reported in my Mid Year 2016 Review, the market elements of "number of sales" and "average sales prices" continue to move in opposite directions. Though mid-year total number of sales were down, numbers of sales for June and July were both above average. It will be interesting to see how sales for the rest of Summer and Fall 2016 pan out.
Historically the 3rd and 4th Quarter sales comprise 42% of the total annual sales. If this figure holds true then the real estate industry in Key West should be happy.
Through July, the average sales price per square foot of $718 is 38% above the same figure thru July 2015 and is 34% above the 5-Year average.
If number of sales for the remainder of the Summer and Fall stumble, then likely Sellers and Realtors will have to cry "Uncle" and pull their List prices down into just the troposphere.
If you have any comments or questions, please contact me here.
Good luck!