
November's ten home sales topped November's 5-year average (2013 - 2017) of sales by two and pushed total sales January-November to 128, passing 2017's total of 121. Exceeding 2016's total of 129 is a given. The 5-year average sales for the year is 143, that is unlikely to be topped but after two down years of sales, 2018's steady Old Town Key West sales are very welcome. On prices, November's average sale price of $1.56M was the highest for 2018 and the average sales price per sqft of $880 was 2nd highest - bot due to a $5M sale. (Without the $5M sale, average sale price would still have topped $1M). The average sale price per square foot thru November is $787; 8% above January-November 2017, 13% above January-November 2016 and 27% above January-November 2015. The deceleration of sale price increases has brought value Buyers back in the market.
_____________________________________________________________________________________
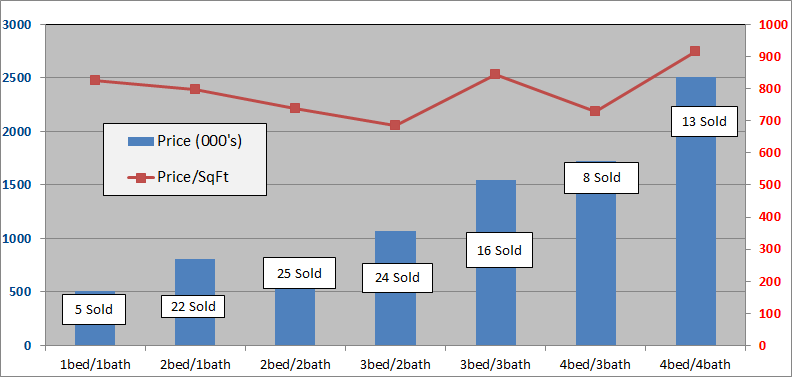
The below charts show sales of the seven most popular bed/bath combinations in Old Town Key West from January 1, 2008 to November 30, 2018. When there is a difference between total home sales and the sum of sales in the below seven charts it is because of a sale of, for instance, a 2bed/3bath or 3bed/1bath house or a house with more than four bedrooms.
These charts are for single family homes sold south and west of White St. and cover the six neighborhoods of The Meadows, Old Town North and South, Bahama Village, Truman Annex and Casa Marina but not Sunset Key. You can view a map of the six neighborhoods of Old Town here. An analysis of 2018 mid-year sales, neighborhood by neighborhood, is here.
The seven bed/bath combinations below contain enough sales to measure and evaluate trends after the 2004-2006 real estate Bubble.
1 Bedroom/1 Bathroom
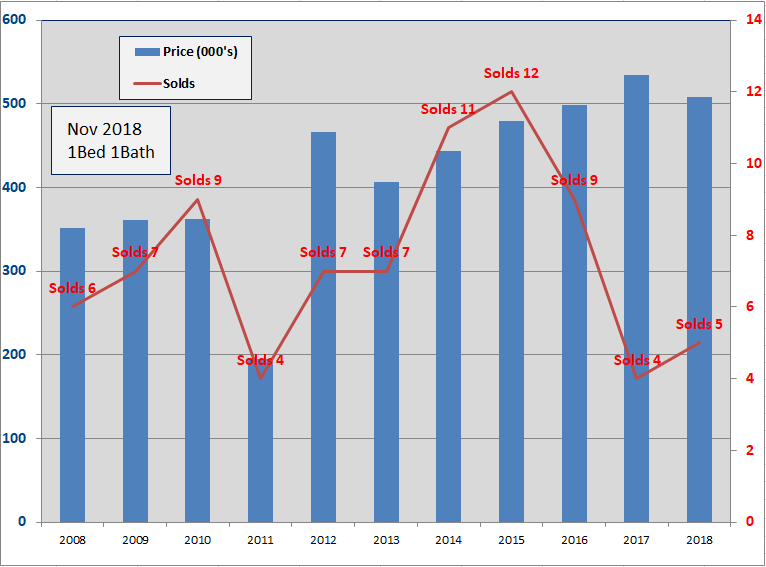
- Five, 1Bed/1Bath homes have sold in the Old Town area thru 11/30/2018. The average number of days to sell is 45 days.
- There are four 1/1 homes for sale from $499K to $995K.
- The 2018 average sale price of $508,000 is 5% less than the average sale price for 2017.
- In 2015, twelve homes sold, the most since 2001. In 2016, 9 sold. In 2017 there were 4 sales.
- The average size of the 2018 homes sold is 615 sq.ft., slightly below average; however, the average sale price per sqft. of $826 is only 4% below 2017.
2 Bedroom/1 Bathroom
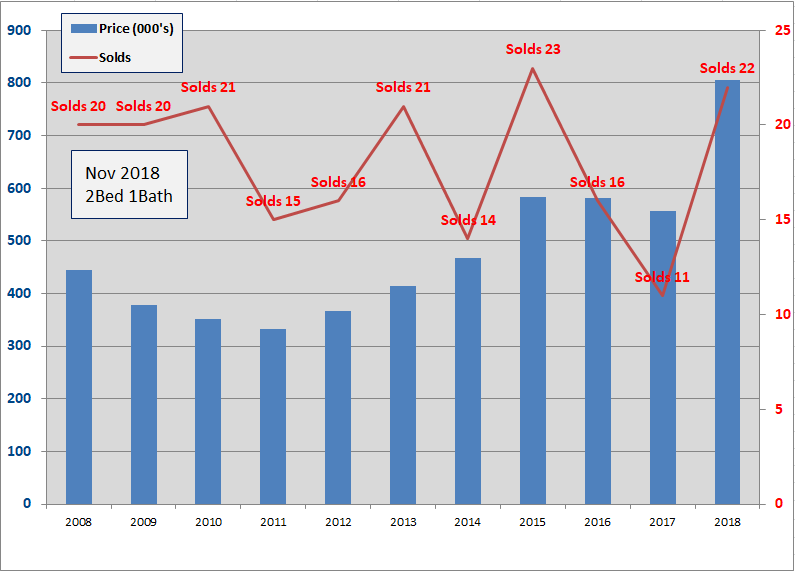
- Twenty-two, 2Bed/1Bath homes have sold in the Old Town area thru 11/30/2018. The average number of days to sell is 77 days.
- The average Sold price of $806,000 is up 45% from 2017 which at $557K was down 4% from 2016. The $806K is 143% above the 2011 low.
- Nine 2/1 homes are for sale with prices from $550K to $925K.
- Sixteen 2/1's sold in 2016, eleven in 2017.
- Since 2009, 2Bed/1Bath homes have been the 3rd most popular selling home in Old Town with 179 sales.
2 Bedroom/2 Bathroom
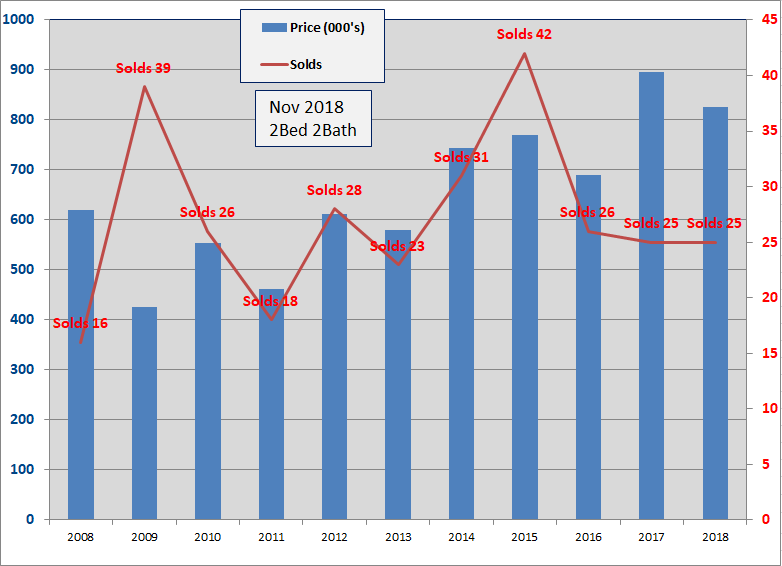
- Twenty-five, 2Bed/2Bath homes have sold in the Old Town area thru 11/30/2018. The number of Days to sell is 14 Days, 1% less than 2017.
- The average sold price of $826,000 is down 8% from 2017 and is 94% above the low in 2009.
- Sixteen 2/2's are for sale, priced between $625,000 and $1.625M.
- The average Sold price per sqft for 2018 is $739. In 2017 the average was $704, in 2016 the average was $614.
- Since 2009, 2Bed/2Bath homes have been the biggest sellers in Old Town Key West with 283 sales.
3 Bedroom/2 Bathroom

- Twenty-four, 3Bed/2Bath homes have sold in the Old Town area thru 11/30/2018. The number of Days to sell is 131 Days.
- The average Sold price of $1,067,000 is up 6% from 2017 which was 2% below 2016 and is 135% above the 2009 low.
- The average sold price per sqft. is $684, up 1% from 2017.
- Twenty-one 3/2's sold in 2015, fifteen in 2016 and twenty-seven in 2017.
- Since 2009, 3Bed/2Bath homes have been the 2nd biggest sellers in Old Town with 204 sales.
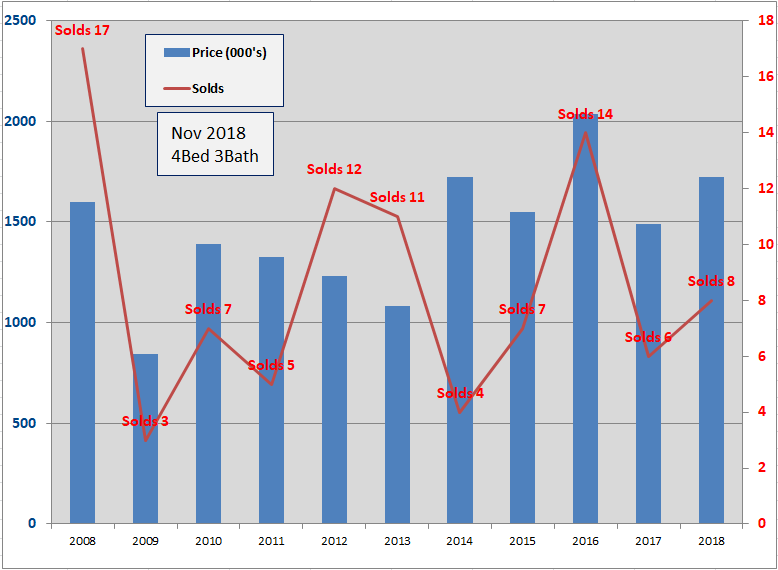
3 Bedroom/3 Bathroom
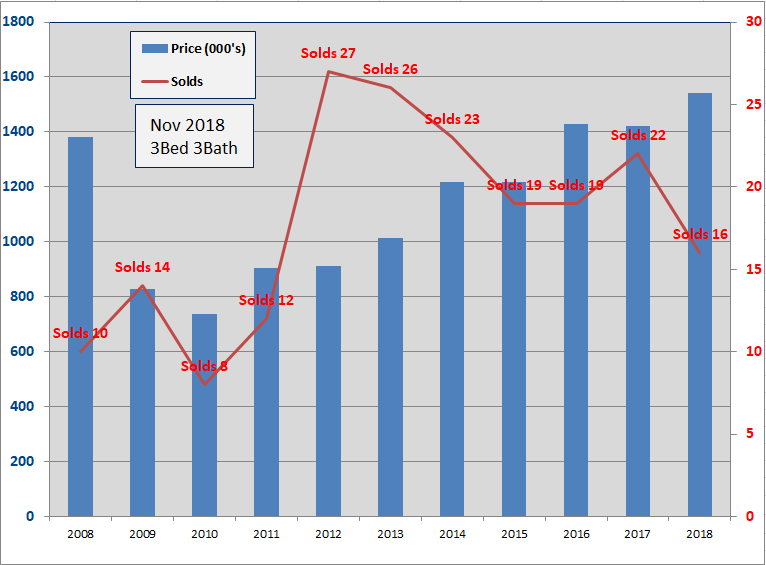
- Sixteen, 3Bed/3Bath homes have sold in the Old Town area thru 11/30/2018. The average number of Days to sell is 175 Days.
- The average sold price of $1.543M is up 9% from 2017 which was 1% below 2016.
- The average Sold price per sqft. of $843 is up 5% from 2017 and is the highest since 2005.
- Nineteen homes sold in both 2015 and 2016 with twenty-two sales in 2017.
- Since 2009, 3Bed/3Bath homes have been the fourth biggest seller in Old Town Key West
4 Bedroom/3 Bathroom
- Eight, 4Bed/3Bath homes have sold in the Old Town area thru 11/30/2018. Average number of days to sell is 120 days. In 2017, the average number of Days to sell was 51 days.
- The average sold price thru November is $1.722M, up 16% over 2017. In 2017 the average sale price was $1.488M with the 5-year average sales price at $1.525M.
- There are nine homes for sale ranging in price from $1.1M to $3.49M.
- Number of sales and sales prices for 4Bed/3Bath homes is very choppy though there has been an erratic up trend in average sale price since 2013.
4 Bedroom/4 Bathroom
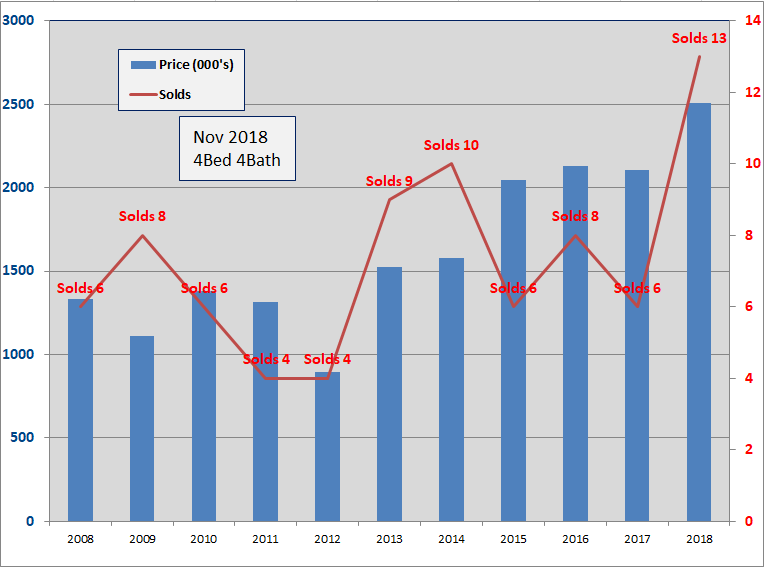
- Thirteen, 4Bed/4Bath homes have sold in the Old Town area thru 11/30/2018. The average number of Days to sell is 118 days. Thirteen sales is a record (going back to Jan 2012).
- There are seven 4/4's for sale ranging from $1.35M to $2.999M.
- The 2018 average Sold price of $2.507M is up 19% from 2017 which was 1% below 2016.
- The average sold price per sq.ft. of $916 is 20% above 2017. (In November a 2550 sqft home sold for $5M).
- Since 2003, average number of annual sales is six, with six in 2015, eight in 2016 and six in 2017. Since 2015, price action has been steady, $2M - $2.3M, despite a limited and choppy number of annual sales.
Conclusion
Buyers continue to show above average confidence in Old Town single family home sales. Overall, prices are up modestly from 2017 and Days on Market are down, in some cases significantly. Cash sales continue to play a major role. Neither slightly rising interest rates nor reduced tax deductions for 2nd home mortgage interest rates have depressed sales. Old Town Buyers have strong financial portfolios and, with their sizeable downpayments, are buying for the long haul.
December looks to be a slow month with three Pending and four Contingent contracts, though there could be transactions brewing behind the MLS.
If you have any comments or questions, please contact me here.
Good luck!