Six single family homes sold in the Old Town area in February 2018. The five-year, 2013 - 2017, average for February sales is eleven. Thirteen homes have sold in January and February 2018; 50% behind the peak year of 2015, 38% fewer than 2016 and 35% fewer than 2017. The previous low in sales for February was in 2012&2014 at eight. The average sale price of February's six sales is $1.27M, bolstered by a $3.1M sale. The average sale price per square foot through February is $728. This is 13% above Jan - Feb 2017; but, this is a flattening curve; that is, the $728 thru February is 30% above 2015, but then only 24% above 2016. Still, we are only two months into the year and the 5-year average shows March - June as the peak months for Closings.
The below charts show sales of the seven most popular bed/bath combinations in Old Town Key West from January 1, 2008 to February 28, 2018. When there is a difference between total home sales and the sum of sales in the below seven charts it is because of a sale of, for instance, a 2bed/3bath or 3bed/1bath house or a house with more than four bedrooms.
These charts are for single family homes sold south and west of White St. and cover the six neighborhoods of The Meadows, Old Town North and South, Bahama Village, Truman Annex and Casa Marina but not Sunset Key. You can view a map of the six neighborhoods of Old Town here and an analysis of 2017 end-of-year sales, neighborhood by neighborhood, here.
The seven bed/bath combinations below contain enough sales to measure and evaluate trends after the 2004-2006 real estate Bubble.
_____________________________________________________________________________________

- Zero, 1Bed/1Bath homes have sold in the Old Town area thru 2/28/2018. 2017 ended with the average number of days to sell as 99 days.
- There are two 1/1 homes for sale at $599K and $1.595M.
- The 2017 average sale price of $534,000 was 7% above the average sale price for 2016.
- In 2015, twelve homes sold, the most since 2001. In 2016, 9 sold. In 2017 there were 4 sales.
- The average size of the 2017 homes sold was 623 sq.ft., slightly above average; however, the average sale price per sqft. was $857, 7% above 2016 and highest since 2005.
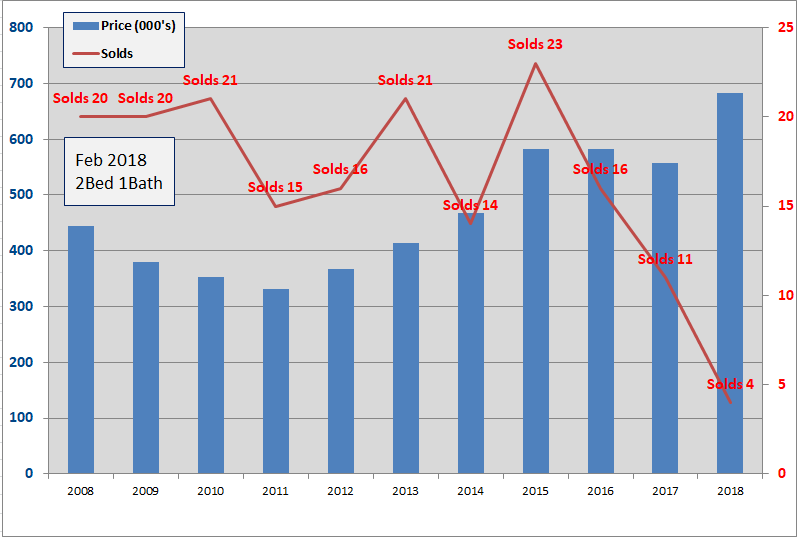
- Four, 2Bed/1Bath homes have sold in the Old Town area thru 2/28/2018. The average number of days to sell is 187 days.
- The average Sold price of $683,000 is up 22% from 2017 which at $557K was down 4% from 2016.
- Nine 2/1 homes are for sale with prices from $576K to $1.2M.
- Sixteen 2/1's sold in 2016, eleven in 2017.
- Since 2009, 2Bed/1Bath homes have been the 3rd most popular selling home in Old Town with 161 sales.
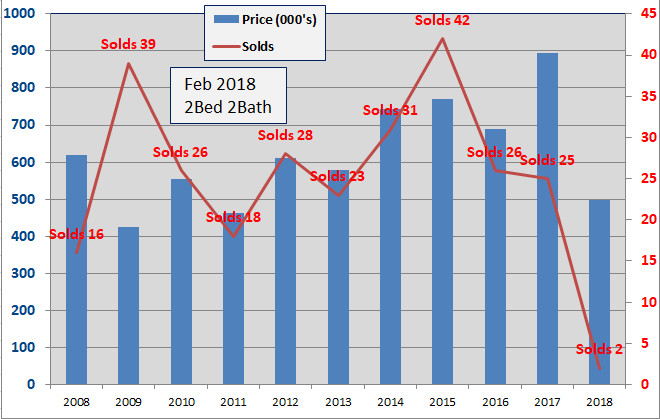
- Two, 2Bed/2Bath homes have sold in the Old Town area thru 2/28/2018. The number of Days to sell is 122 Days. In 2017 the average was 106 days.
- The sold price of $880,000 is down 2% from 2017 and is 107% above the low in 2009.
- Nineteen 2/2's are for sale, priced between $600,000 and $1.68M.
- The Sold price per sqft for 2018 is $897. In 2017 the average was $704, in 2016 the average was $614.
- Since 2009, 2Bed/2Bath homes have been the biggest sellers in Old Town Key West with 260 sales.

- Two, 3Bed/2Bath homes have sold in the Old Town area thru 2/28/2018. The number of Days to sell is 322 Days.
- The average Sold price of $1,133,000 is up 12% from 2017 which was 2% below 2016 and is 146% above the 2009 low.
- The sold price per sqft. is $672, identical to 2017.
- Twenty-one sold in 2015, fifteen in 2016 and twenty-seven in 2017.
- Since 2009, 3Bed/2Bath homes have been the 2nd biggest sellers in Old Town with 182 sales.
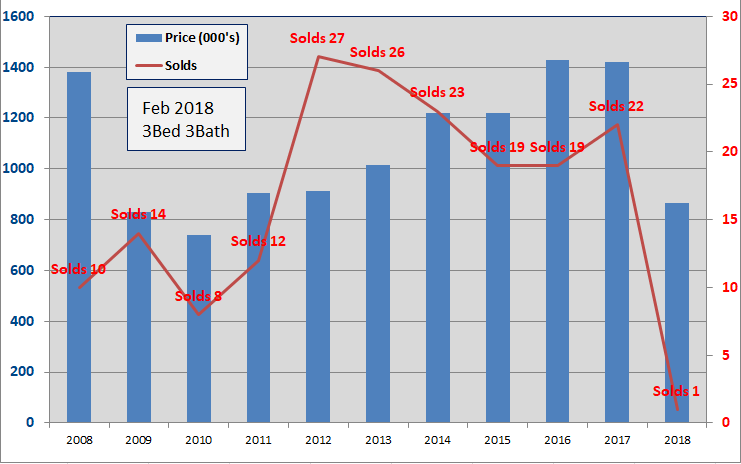
- One, 3Bed/3Bath home has sold in the Old Town area thru 2/28/2018. The number of Days to sell is 884 Days!
- The sold price of $865K is down 39% from 2017 which was 1% below 2016.
- The average Sold price per sqft. of $576 is down 29% from 2017. 2017's $806 was the highest since 2005.
- Nineteen homes sold in 2015 and 2016 with twenty-two sales in 2017.
- Since 2009, 3Bed/3Bath homes have been the fourth biggest seller in Old Town Key West
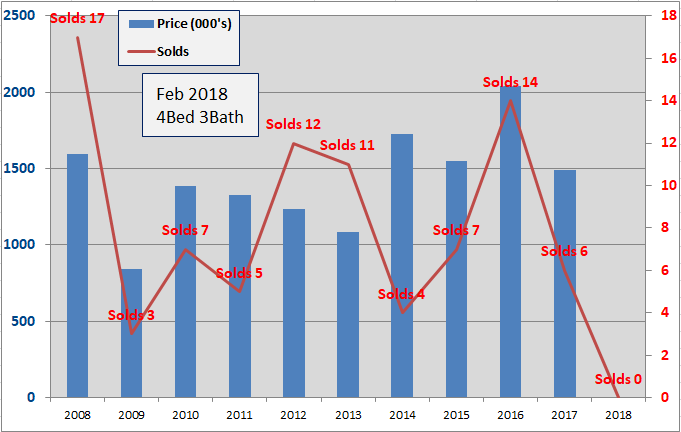
- Zero, 4Bed/3Bath homes have sold in the Old Town area thru 2/28/2018. In 2017, the average number of Days to sell was 51 days.
- The 2017 average sale price of $1.488M was 27% below 2016 with the 5-year average sales price of $1.525M.
- The 2017 average Sold price per sq.ft. was $813, down 4% from 2016 yet well above the 5-yr average of $638.
- Number of sales and sales prices for 4Bed/3Bath homes is very choppy though there has been an upward trend in average sale price since 2013.
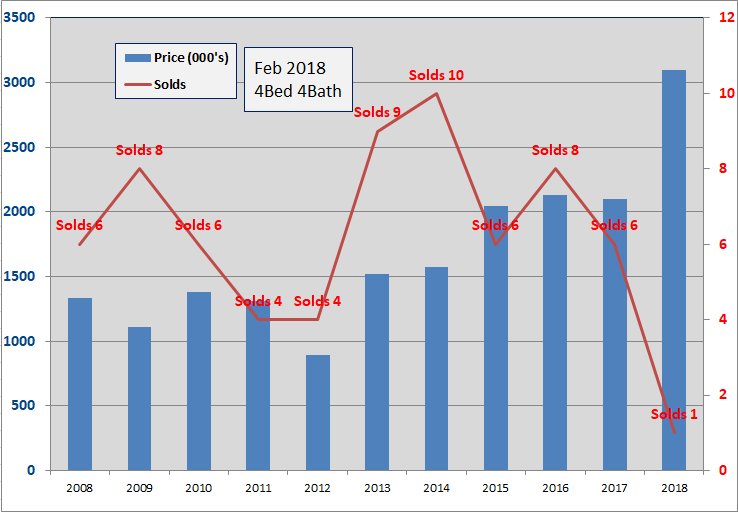
- One, 4Bed/4Bath home has sold in the Old Town area thru 2/28/2018. Days on Market was 90 days. In 2017 the average number of Days to sell was 185 days.
- There are eleven 4/4's for sale ranging from $1.2M to $6.2M.
- The 2018 Sold price is $3.1M, up 47% from 2017 which was 1% below 2016.
- The 2018 sold price per sq.ft. of $911 is 20% above 2017.
- Since 2003, average number of annual sales is six, with six in 2015, eight in 2016 and six in 2017.
- Year to year price action is choppy as a limited number of annual sales causes large fluctuations in average sales price.
Summary

The peak year for total home sales was 2015 at 171 sales; then 129 sales in 2016 and 121 sales in 2017. Average sale prices have remained high at $902,000 in 2017 and $1.184 in both 2016 and 2017.
The slow start to 2018 sales could be a reflection of the same mild malaise affecting shops, eateries and hotels and B&B's, though their dropoff is a tourism based symptom.
The good news is there are five Contingent and nineteen Pending contracts waiting in the wings for Closing in March and April. Add in a few pocket tranactions and 2018 may put itself back on track.
If you have any comments or questions, please contact me here.
Good luck!