Despite June's tepid sales (9), eighty-six single family homes sold in Old Town thru June 30, 2019, 15% more than 2018 and the most in the 1st half of the year since 2015. The 5-year (2014 - 2018) average for sales per year is 141 with March - June (The Season) comprising 44% or 62 sales. March - June 2019 had 62 sales! Right on target. On prices, the 2nd Qtr 2019 was the 7th Quarter in a row with an average sales price over $1M. The average sales price per sqft for the 1st half is $791, topping the 5 year average by 24% but up only 1% from the end of 2018.
_____________________________________________________________________________________
The below charts show sales of the seven most popular bed/bath combinations in Old Town Key West from January 1, 2010 to June 30, 2019. When there is a difference between total home sales and the sum of sales in the below seven charts it is because of a sale of, for instance, a 2bed/3bath or 3bed/1bath house or a house with more than four bedrooms.
These charts are for single family homes sold south and west of White St. and cover the six neighborhoods of The Meadows, Old Town North and South, Bahama Village, Truman Annex and Casa Marina but not Sunset Key. You can view a map of the six neighborhoods of Old Town here. An analysis of 2019 mid-year sales, neighborhood by neighborhood, is here.
The seven bed/bath combinations below contain enough sales to measure and evaluate trends after the 2004-2006 real estate Bubble.
1 Bedroom/1 Bathroom
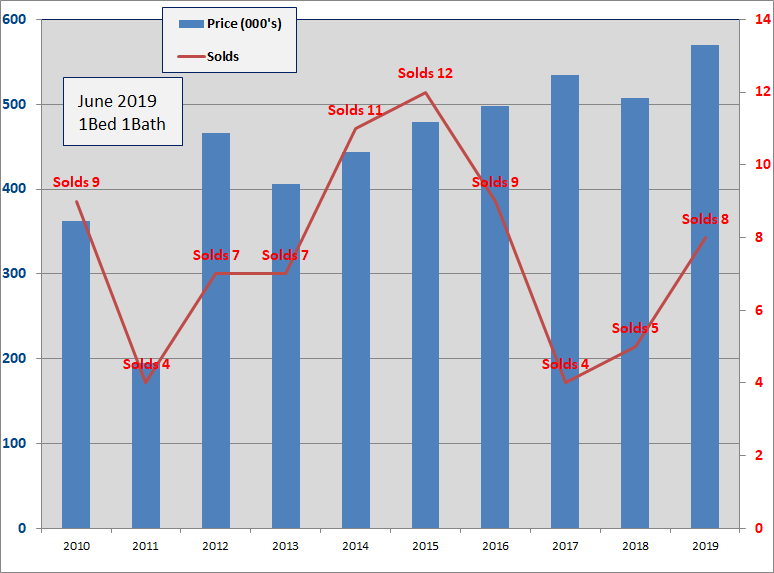
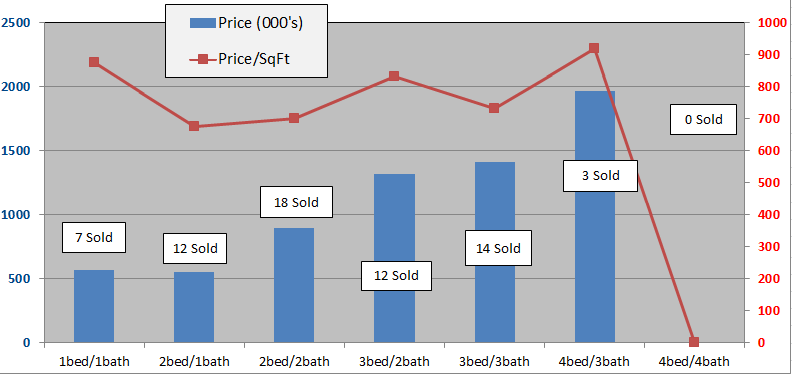
- Eight, 1Bed/1Bath homes have sold in the Old Town area thru 6/30/2019. The average number of days to sell is 72 days.
- There are four 1/1 homes for sale from $499K to $608K.
- The 2019 average sale price of $570,000 is 12% more than the average sale price for 2018.
- The eight homes sold thru June tops total sales in both 2018 and 2017. In 2015, twelve homes sold, but sales had fallen every year since.
- The average size of the 2019 homes sold is 652 sq.ft., slightly above average. The average sale price per sqft. of $874 is 6% above 2018
2 Bedroom/1 Bathroom
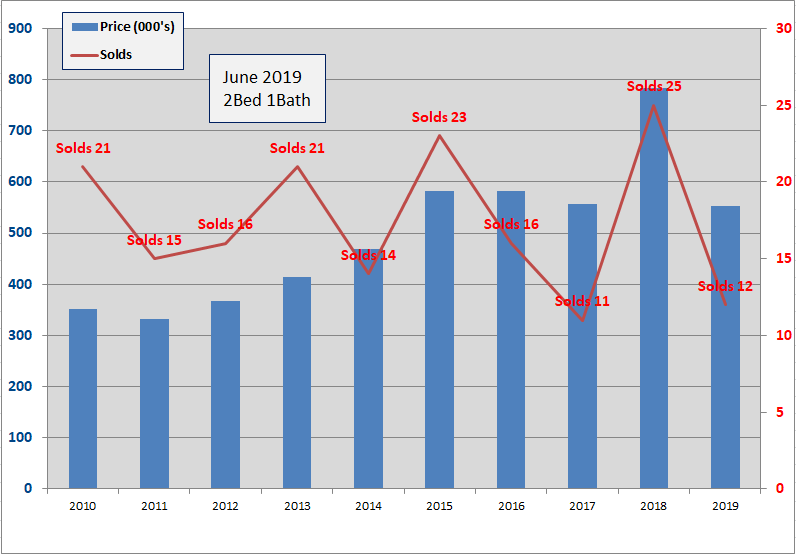
- Twelve, 2Bed/1Bath homes have sold in the Old Town area thru 6/30/2019. The average number of days to sell is 146 days. (One home at 600+ days).
- The average Sold price of $553,000 is down 29% from 2018 which at $784K was up 41% from 2017. The $553K is 57% above the 2011 low.
- Five 2/1 homes are for sale with prices from $560K to $759K.
- Sixteen 2/1's sold in 2016, eleven in 2017, twenty-five in 2018.
- Since 2009, 2Bed/1Bath homes have been the 3rd most popular selling home in Old Town with 194 sales.
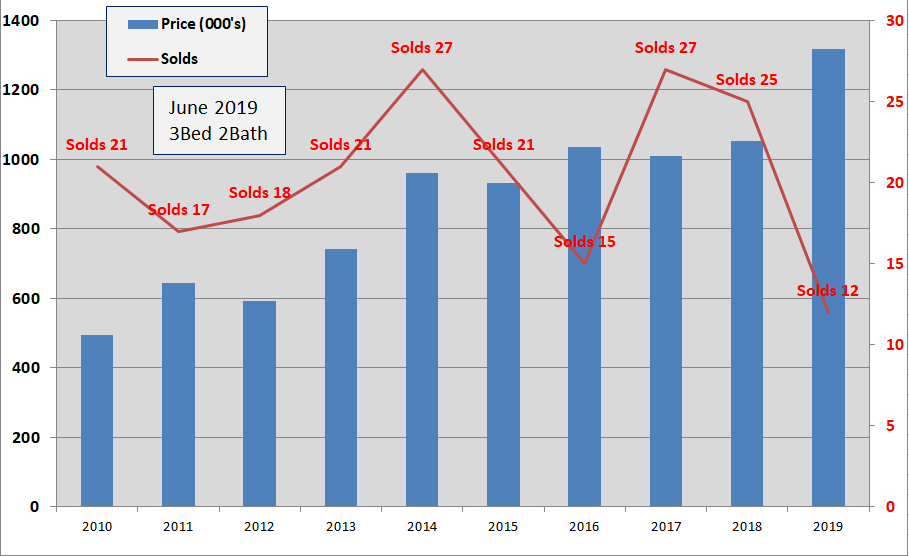
2 Bedroom/2 Bathroom
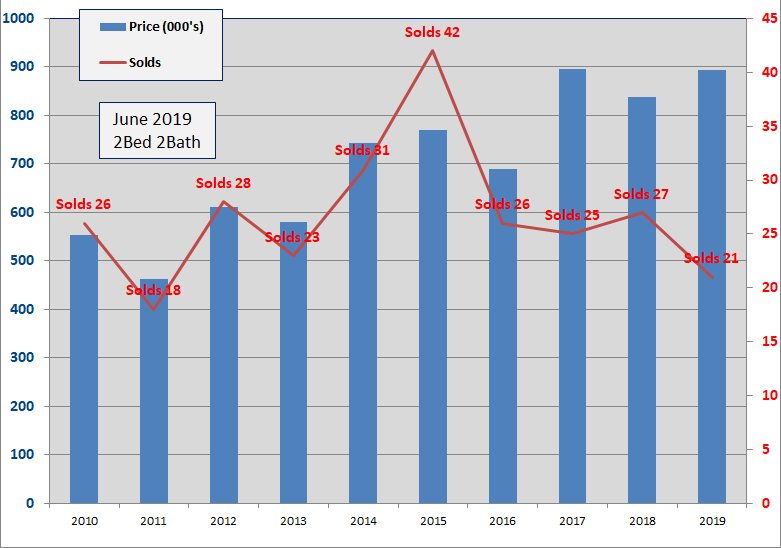
- Twenty-one, 2Bed/2Bath homes have sold in the Old Town area thru 6/30/2019. The average number of Days to sell is 75 Days, 33% faster than 2018.
- The average sold price of $893,000 is up 7% from 2018 and is 110% above the low in 2009.
- Seventeen 2/2's are for sale, priced between $769,000 and $1.575M.
- The average Sold price per sqft for 2019 is $698. In 2018 the average was $747, in 2017 the average was $704.
- Since 2009, 2Bed/2Bath homes have been the biggest sellers in Old Town Key West with 306 sales.
3 Bedroom/2 Bathroom
- Twelve, 3Bed/2Bath homes have sold in the Old Town area thru 6/30/2019. The average number of Days to sell is 138 Days.
- The average Sold price of $1,318,000 is up 25% from 2018 which was 2% above 2017 and is 186% above the 2009 low.
- The average sold price per sqft. is $832, up 21% from 2018.
- Fifteen 3/2's sold in 2016, twenty-seven in 2017 and twenty-five in 2018.
- Since 2009, 3Bed/2Bath homes have been the 2nd biggest sellers in Old Town with 217 sales.
3 Bedroom/3 Bathroom
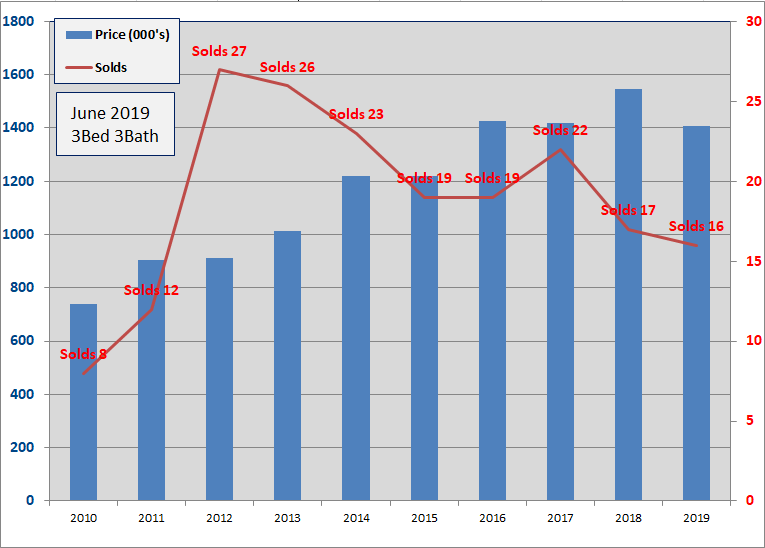
- Sixteen, 3Bed/3Bath homes have sold in the Old Town area thru 6/30/2019. The average number of Days to sell is 100 Days.
- The average sold price of $1.409M is down 9% from 2018 which was 9% above 2017.
- The average Sold price per sqft. of $730 is down 14% from 2018 and is the first down year since 2010.
- Nineteen homes sold in both 2015 and 2016 with twenty-two sales in 2017 and seventeen in 2018.
- Since 2009, 3Bed/3Bath homes have been the fourth biggest seller in Old Town Key West
4 Bedroom/3 Bathroom
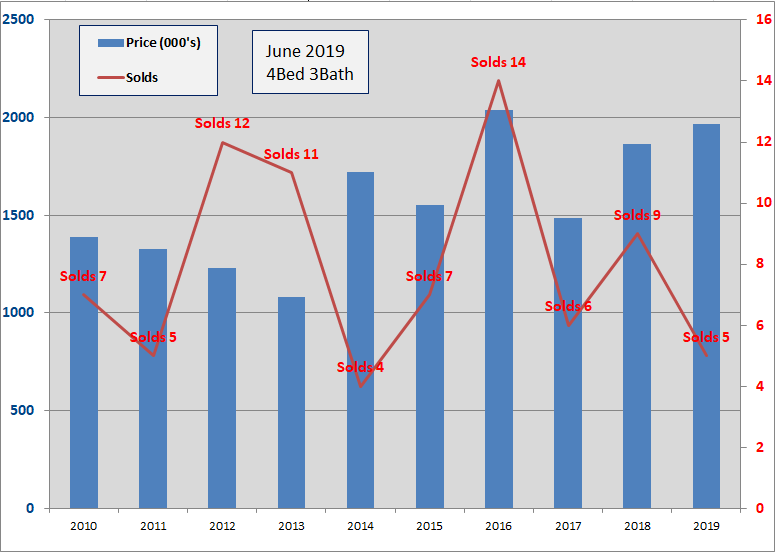
- Five, 4Bed/3Bath homes have sold in the Old Town area thru 6/30/2019. The average number of days to sell is 124 days.
- The average sold price for 2019 sales is $1.9675M, up 6% over 2018. The 5-year average sales price is $1.732M.
- The average sales price per sqft is $918, up 23% over 2018.
- There are thirteen homes for sale, ranging in price from $950K to $3.75M.
- Number of sales and sales prices for 4Bed/3Bath homes is very choppy though there has been an erratic up trend in average sale price since 2013.
4 Bedroom/4 Bathroom
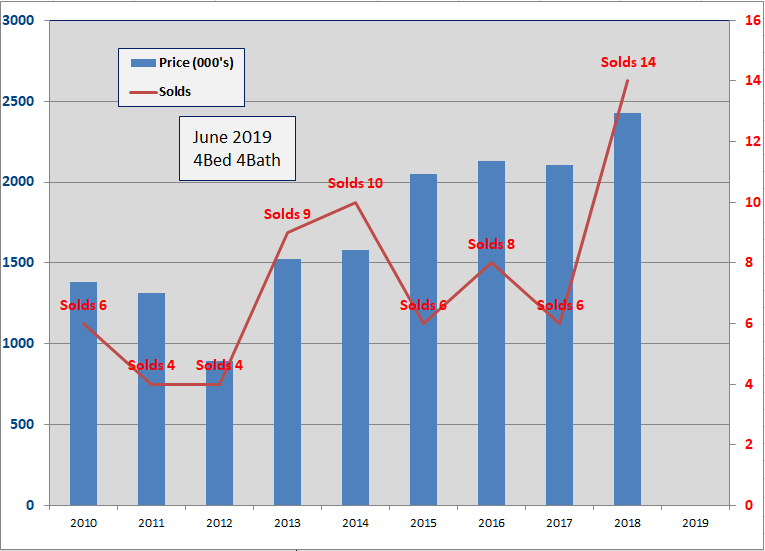
- Zero, 4Bed/4Bath homes have sold in the Old Town area thru 6/30/2019. Fourteen homes sold in 2018, the most on record.
- There are eight 4/4's for sale ranging from $1.79M to $3.395M.
- The 2018 average Sold price of $2.424M was up 14% over 2017 which was 1% below 2016.
- The 2018 average sold price per sq.ft. of $912 was 20% above 2017.
- Since 2003, average number of annual sales is six, with eight in 2016, six in 2017 and fourteen in 2018. Since 2015, price action has been steady, $2M - $2.4M, despite a limited and choppy number of annual sales.
Summary
Looking at the Sales by Neighborhood report here tells me that buyers specifically bargain hunted (Bahama Village), bought investment property (Truman Annex) and bought second homes (The Meadows) in three classic Old Town neighborhoods, the net of which is the best 1st Half for sales since 2015. An increase in the volume of sales strengthens the market and buffers against any short-term setbacks.
On prices, average sales price for both the 1st and 2nd Quarters topped $1M; however, the 2nd Quarter was lower than the 1st due to a significant increase in the number of homes sold below $800K. In fact, reduced interest rates played an outsized role in 1st half sales. Rates at and below 4% expanded the buyer pool by allowing more buyers to qualify for mortgages in order to purchase their Key West getaway.
Over the past 5 years, cash sales in Old Town have steadied at an annual rate of 52% of sales. Due to the increase in financed purchases, the 1st Half saw this figure drop to 42% of sales; still though, well above the national average of 25%.
Conclusion

Thru June and despite a medium correction in May, the Nasdaq is up 21% and the S&P 500 is up 18%. The mix and match of positive and negative news; a sympathetic Federal Reserve ready to lower interest rates to keep the economy moving forward, low unemployment and low inflation competing against tariffs (implied and actual), trade tensions and underfunded Federal obligations (Social Security, Medicare) make for interesting forecasting and yet -
The net of these competing influences and the risk to manage them must be positive as an increasing number of buyers don't spend big money on second homes and investment property without the comfort of anticipating overall good economic conditions. At least I don't!
My prediction for the 2nd half of 2019?
Hot through the middle of October with a slow and gradual un-heating until Thanksgiving when I close up the pool and break out the cardigan for winter.
If you have any comments or questions, please contact me here.
Good luck!