
In 2015 there were 171 Single family homes sold in the Old Town area, in 2016, 129 sales and for 2017 there were 121 sales. Only February and October 2017 exceeded the 2012 - 2016, 5-year average number of sales in a month. The 1st half of 2017 dominated with 62% of sales, 2nd half 38%. May had the most sales with 17, September (Irma) the fewest with 3. Meanwhile, prices held high-steady. Average sale price per square foot was $724, up 4% over 2016 and up 23% over the 5-year average. The 2017 average sales price of $1,181,000 was identical to 2016 as six of the last eight quarters had average sales prices over $1M.
The below charts show sales of the seven most popular bed/bath combinations in Old Town Key West from January 1, 2007 to December 31, 2017. When there is a difference between total home sales and the sum of sales in the below seven charts it is because of a sale of, for instance, a 2bed/3bath or 3bed/1bath house or a house with more than four bedrooms.
These charts are for single family homes sold south and west of White St. and cover the six neighborhoods of The Meadows, Old Town North and South, Bahama Village, Truman Annex and Casa Marina but not Sunset Key. You can view a map of the six neighborhoods of Old Town here and an analysis of 2017 end-of-year sales, neighborhood by neighborhood, here.
The seven bed/bath combinations below contain enough sales to measure and evaluate trends after the 2004-2006 real estate Bubble.
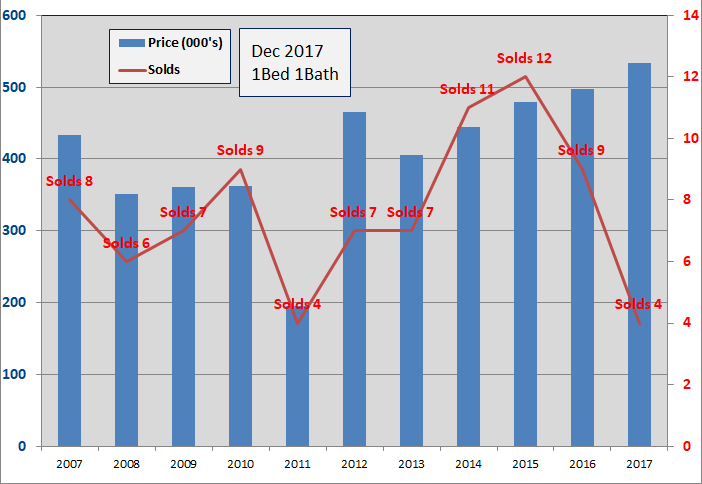
- Four, 1Bed/1Bath homes have sold in the Old Town area thru 12/31/2017. The average number of days to sell is 99 days.
- There is one 1/1 for sale at $1.595M.
- The 2017 average sale price of $534,000 is 7% above the average sale price for 2016.
- In 2014, eleven homes sold. In 2015, twelve homes sold, the most since 2001. In 2016, 9 sold.
- The average size of the 2017 homes sold is 623 sq.ft., slightly above average; however, the average sale price per sqft. is $857, 7% above 2016 and highest since 2005.
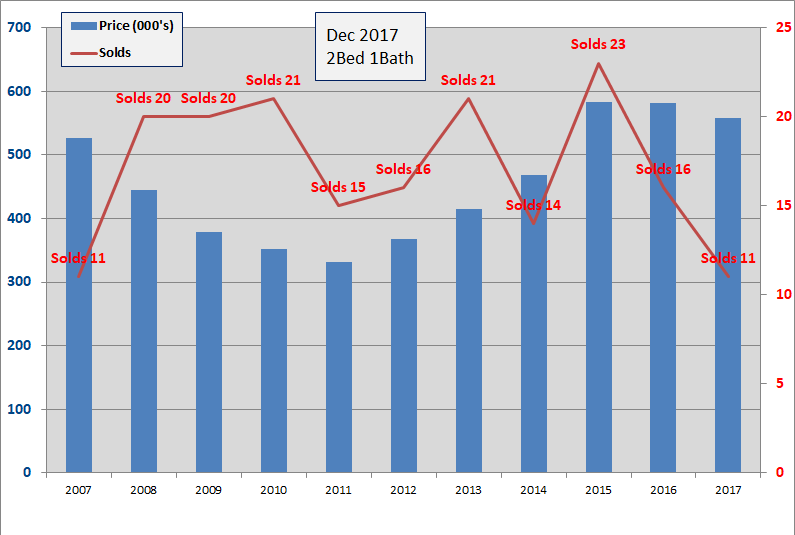
- Eleven, 2Bed/1Bath homes have sold in the Old Town area thru 12/31/2017. The average number of days to sell is 166 days.
- The average Sold price of $557,000 is down 4% from 2016 which at $582K was unchanged from 2015.
- Five 2/1 homes are for sale with prices from $575K to $1.2M.
- Twenty-three homes sold in 2015, sixteen in 2016.
- Since 2009, 2Bed/1Bath homes have been the 3rd most popular selling home in Old Town with 157 sales.
Two bed/two bathroom homes saw the largest sales price increase in 2017 - 30%.
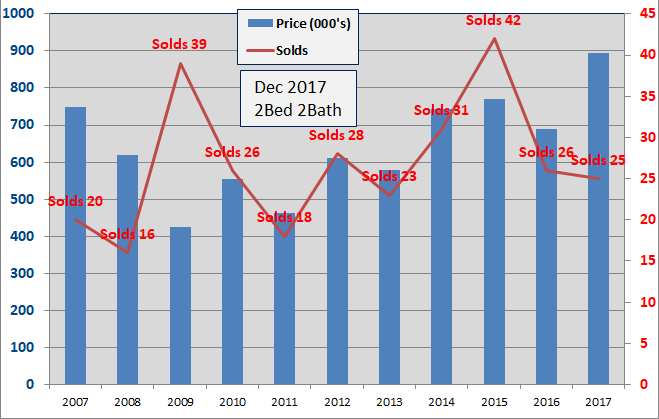
- Twenty-five, 2Bed/2Bath homes have sold in the Old Town area thru 12/31/2017. The average number of Days to sell is 106 Days.
- The average sold price of $895,000 is up 30% from 2016 and is 111% above the low in 2009.
- Fifteen 2/2's are for sale, priced between $600,000 and $1.495M.
- The average Sold price per sqft for 2017 is $704. In 2016 the average was $614.
- Since 2009, 2Bed/2Bath homes have been the biggest sellers in Old Town Key West with 258 sales.
Only three bedroom homes saw an increase in the number of sales in 2017.
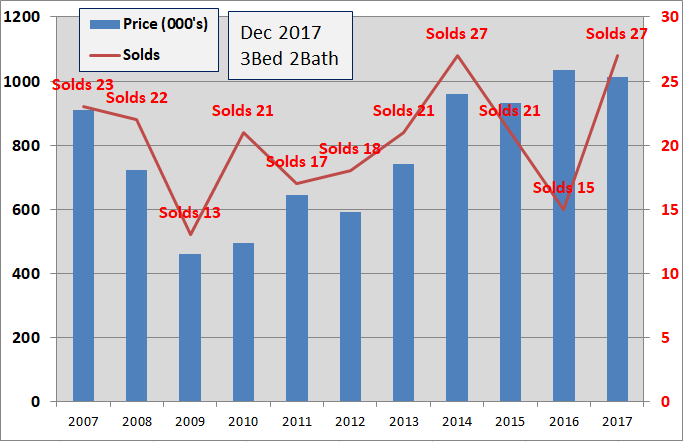
- Twenty-seven, 3Bed/2Bath homes have sold in the Old Town area thru 12/31/2017. The average number of Days to sell is 150 Days.
- The average Sold price of $1,011,000 is down 2% from 2016 which was 11% above 2015 and is 119% above the 2009 low.
- The average sold price per sqft. is $674, down 3% from 2016.
- Twenty-seven 3/2's sold in 2014, twenty-one sold in 2015 but only fifteen in 2016.
- Since 2009, 3Bed/2Bath homes have been the 2nd biggest sellers in Old Town with 180 sales.
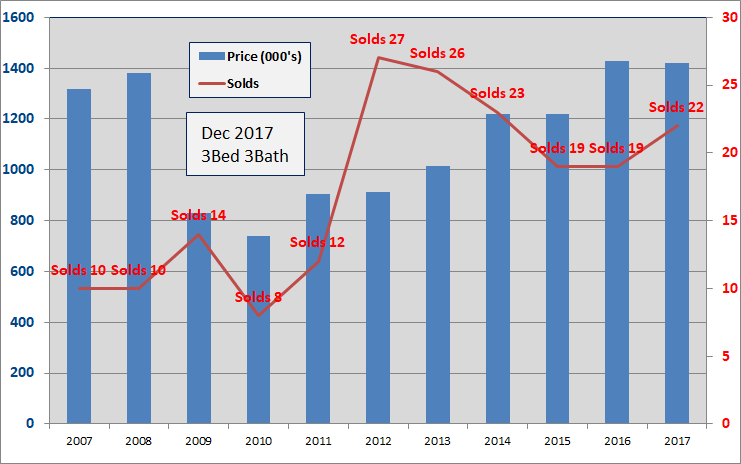
- Twenty-two, 3Bed/3Bath homes have sold in the Old Town area thru 12/31/2017. The average number of Days to sell is 83 Days.
- The average sold price of $1.420M is down 1% from 2016 which was 20% above 2015.
- The average Sold price per sqft. of $806 is up 9% from 2016 and is the highest since 2005.
- Twenty-three 3/3's sold in 2014, nineteen in 2015 and nineteen in 2016.
- Since 2009, 3Bed/3Bath homes have been the fourth biggest seller in Old Town Key West.
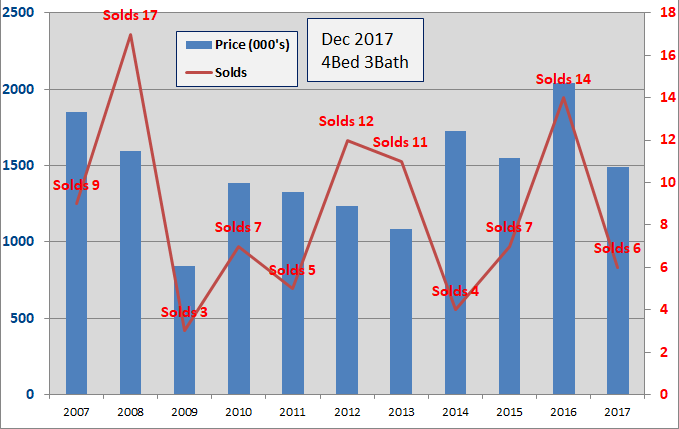
- Six, 4Bed/3Bath homes have sold in the Old Town area thru 12/31/2017. The average number of Days to sell is 51 days.
- The average sale price of $1.488M is 27% below 2016 with the 5-year average sales price of $1.525M.
- The average Sold price per sq.ft. is $813, down 4% from 2016 yet remains well above the 5-yr average of $638.
- Number of sales and sales prices for 4Bed/3Bath homes is very choppy though there has been an upward trend in average sale price since 2013.
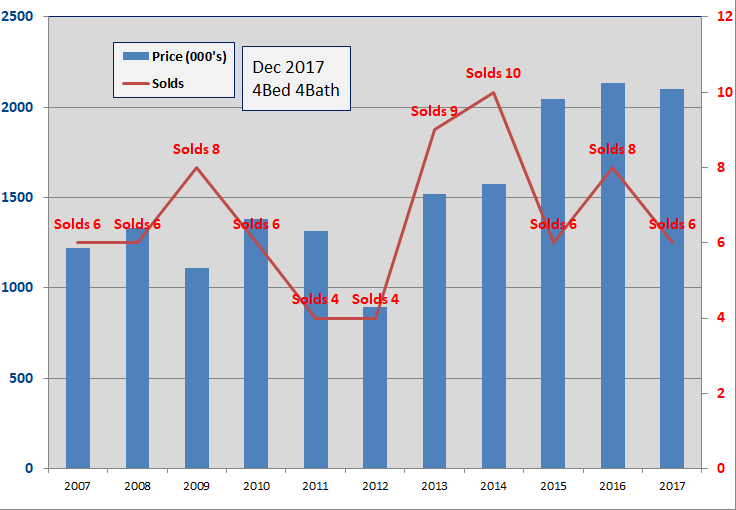
- Six, 4Bed/4Bath homes have sold in the Old Town area thru 12/31/2017. Average number of Days to sell is 185 days.
- There are six 4/4's for sale ranging from $1.95M to $6.25M.
- The 2017 average Sold price is $2.103M, down 1% from 2016 which was 4% above the 2015.
- The 2017 average sold price per sq.ft. of $762 is 6% below 2016.
- Since 2003, average number of annual sales is six, with nine sold in 2013, ten in 2014, six in 2015 and eight in 2016.
- Year to year price action is choppy as a limited number of annual sales causes large fluctuations in average sales price.
Summary

So where are the Buyers?
In 2017 the US stock markets, long revenue sources for sales of selective, second home real estate, notched more closing highs than ever! In 2017, the S&P rose 19%, the NASDAQ rose 28% and the Dow rose 25%, 4th highest since 1997. Volatility was zilch.
Many global markets, from Argentina to Germany to India to South Korea, finished the year near record or multi-year highs. Combine this with a 7.5% drop in the overall value of the Dollar and a 14% rise in the value of the Euro versus the Dollar and foreign buyers should be standing in line. But they are not. (Even though Florida is the #1 state for purchases of real estate by foreigners.)
Where are the buyers?
Consumer confidence, business optimism, employment, wages and inflation and individual and corporate taxes are all moving in positive directions.
The real estate industry; homebuilders, REITs and restoration/home improvement businesses are almost all moving in positive directions. Many are becoming integral parts of the financial plans of individuals, families and institutions.
As stated at the end of November's blog, a shift in the Key West Buyer has brought greater scrutiny to the impact a 33040 home will have on the long-term financial security of a younger, pre-retirement Buyer. Since the 2009/2010 bottom, the focus has been on growth and appreciation. Now that average sale prices are nearly, at, or more than, 100% above their 2009/2010 bottom, Buyers are looking more closely for value. Not only value in the home itself but in Key West as well - health care, infrastructure, insurance, the cost of building code compliance.
Predictions, like crystal balls, are usually only as good as the color of their packaging. Yet, if you believe in the maxim "The trend is your friend" then fewer sales will likely continue as careful buyers apply their definition of "value" to Key West 33040.
If you have any comments or questions, please contact me here.
Good luck and welcome to 2018!