Six single family homes Sold in Old Town Key West in September. The five year (2014 - 2018) average is eight sales. Yet, even with only six sales, sales thru September are 5% ahead of Jan - Sep 2018 and 18% ahead of Jan - Sep 2017. September thru December are the weakest months for sales with each month having a 5-year average of either 8 or 9 sales. On prices, six sales neither make nor break a trend. The September average sales price was $1.19M, the eighth month in 2019 over $1M and average sales price per square feet for the year increased slightly to $806.
_____________________________________________________________________________________
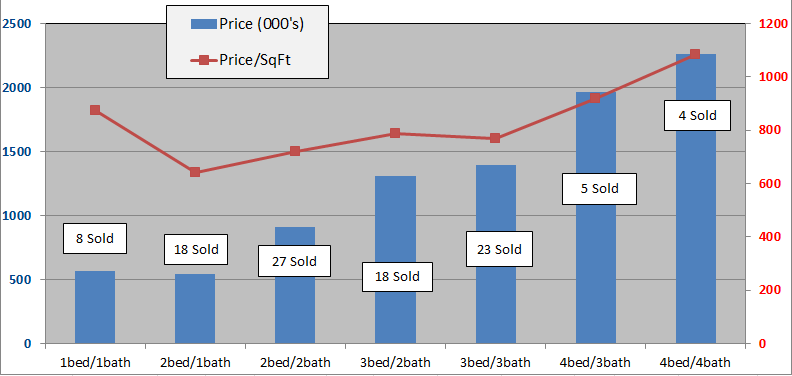
The below charts show sales of the seven most popular bed/bath combinations in Old Town Key West from January 1, 2010 to September 30, 2019. When there is a difference between total home sales and the sum of sales in the below seven charts it is because of a sale of, for instance, a 2bed/3bath or 3bed/1bath house or a house with more than four bedrooms.
These charts are for single family homes sold south and west of White St. and cover the six neighborhoods of The Meadows, Old Town North and South, Bahama Village, Truman Annex and Casa Marina but not Sunset Key. You can view a map of the six neighborhoods of Old Town here. An analysis of 2019 mid-year sales, neighborhood by neighborhood, is here.
The seven bed/bath combinations below contain enough sales to measure and evaluate trends after the 2004-2006 real estate Bubble.
1 Bedroom/1 Bathroom
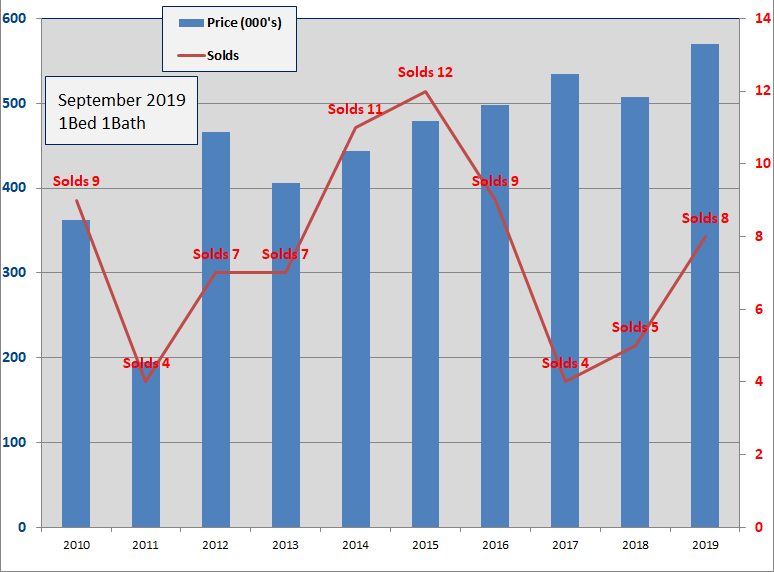
- Eight, 1Bed/1Bath homes have sold in the Old Town area thru 9/30/2019. The average number of days to sell is 72 days.
- There are three 1/1 homes for sale from $599K to $738K.
- The 2019 average sale price of $570,000 is 12% more than the average sale price for 2018 and 192% above the 2011 low.
- The eight homes sold thru August tops total sales in both 2018 and 2017. In 2015, twelve homes sold, but sales had fallen every year since.
- The average size of the 2019 homes sold is 652 sq.ft., slightly above average. The average sale price per sqft. of $874 is 6% above 2018.
2 Bedroom/1 Bathroom

- Eighteen, 2Bed/1Bath homes have sold in the Old Town area thru 9/30/2019. The average number of days to sell is 129 days.
- The average Sold price of $543,000 is down 31% from 2018 which at $784K was up 41% from 2017. The $541K is 54% above the 2011 low.
- Two 2/1 homes are for sale with prices from $625K to $799K.
- Sixteen 2/1's sold in 2016, eleven in 2017, twenty-five in 2018.
- Since 2009, 2Bed/1Bath homes have been the 3rd most popular selling home in Old Town with 199 sales.
2 Bedroom/2 Bathroom
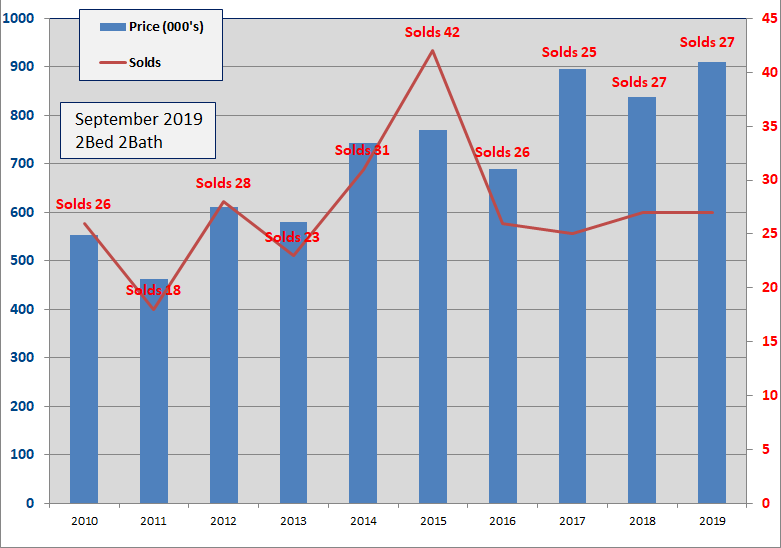
- Twenty-seven, 2Bed/2Bath homes have sold in the Old Town area thru 9/30/2019. The average number of Days to sell is 72 Days, 36% faster than 2018.
- The average sold price of $911,000 is up 9% from 2018 and is 114% above the low in 2009.
- Nineteen 2/2's are for sale, priced between $700K and $1.35M.
- The average Sold price per sqft for 2019 is $718. In 2018 the average was $747, in 2017 the average was $704.
- Since 2009, 2Bed/2Bath homes have been the biggest sellers in Old Town Key West with 312 sales.
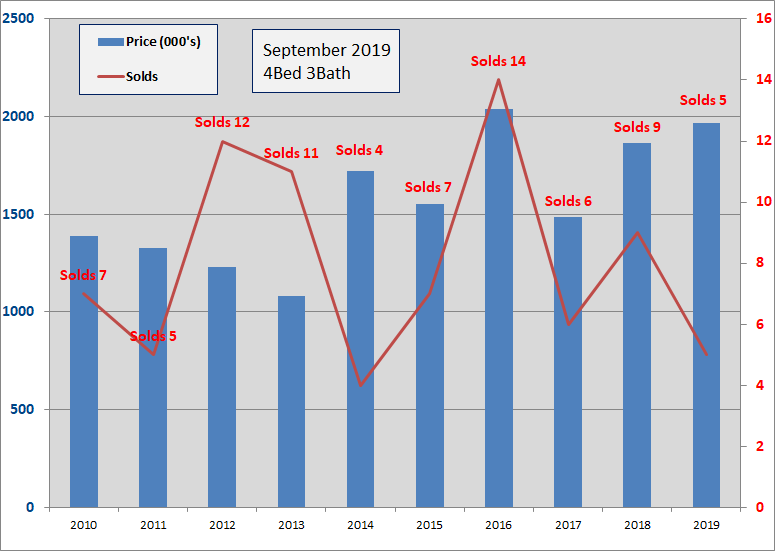
3 Bedroom/2 Bathroom

- Eighteen, 3Bed/2Bath homes have sold in the Old Town area thru 9/30/2019. The average number of Days to sell is 110 Days.
- The average Sold price of $1,311,000 is up 24% from 2018 which was 2% above 2017 and is 184% above the 2009 low.
- The average sold price per sqft. is $788, up 15% from 2018.
- Fifteen 3/2's sold in 2016, twenty-seven in 2017 and twenty-five in 2018.
- Since 2009, 3Bed/2Bath homes have been the 2nd biggest sellers in Old Town with 223 sales.
3 Bedroom/3 Bathroom
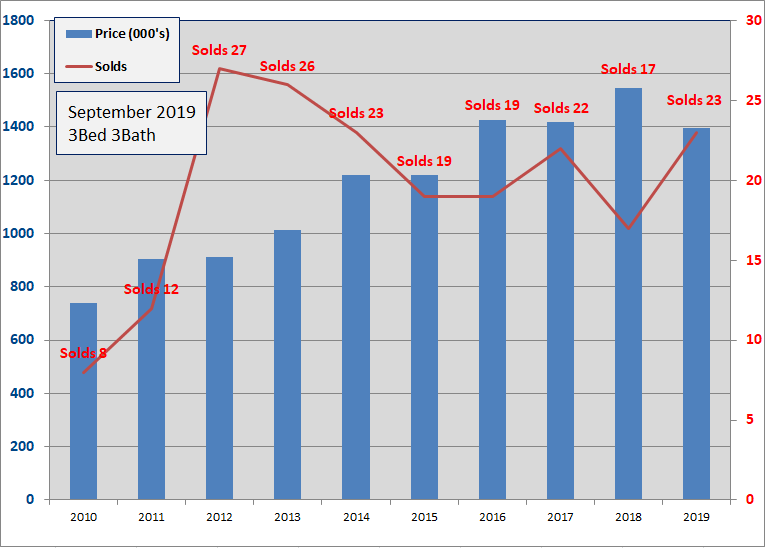
- Twenty-three, 3Bed/3Bath homes have sold in the Old Town area thru 9/30/2019. The average number of Days to sell is 140 Days.
- The average sold price of $1.398M is down 10% from 2018 which was 9% above 2017.
- The average Sold price per sqft. of $768 is down 9% from 2018 and is the first down year since 2010.
- Nineteen homes sold in both 2015 and 2016 with twenty-two sales in 2017 and seventeen in 2018.
- Since 2009, 3Bed/3Bath homes have been the fourth biggest seller in Old Town Key West
4 Bedroom/3 Bathroom
- Five, 4Bed/3Bath homes have sold in the Old Town area thru 9/30/2019. The average number of days to sell is 124 days.
- The average sold price for 2019 sales is $1.9675M, up 6% over 2018 and 133% above the 2009 low. The 5-year average sales price is $1.732M.
- The average sales price per sqft is $918, up 23% over 2018.
- There are eleven homes for sale, ranging in price from $950K to $3.75M.
- Number of sales and sales prices for 4Bed/3Bath homes is very choppy though there has been an erratic up trend in average sale price since 2013.
4 Bedroom/4 Bathroom
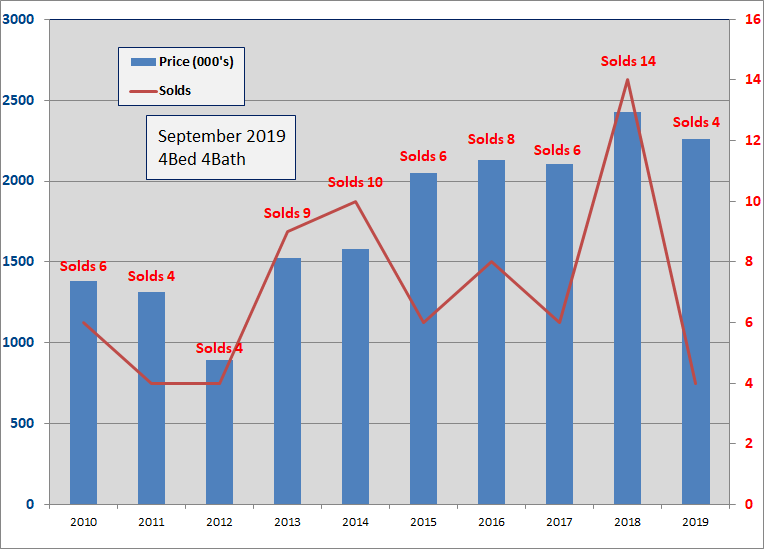
- Four, 4Bed/4Bath homes have sold in the Old Town area thru 9/30/2019. Days on market was 27 days. Fourteen homes sold in 2018, the most on record.
- There are four 4/4's for sale ranging from $1.78M to $3.2M.
- The 2019 average sold price of $2.26M is down 7% from 2018 which was up 15% over 2017.
- The 2019 average sold price per sq.ft. of $1084 is up 19% over 2018. (One house sold in July 2019 is located in Truman Annex).
- Since 2003, average number of annual sales is six, with eight in 2016, six in 2017 and fourteen in 2018. Price action has been steady, $2M - $2.4M, despite a choppy number of sales.
Summary
Despite the seasonal slowdown, there remains a high degree of confidence in the Old Town Key West market. This can best be seen in the steady rise in Cash sales. Of the 116 sales Jan - Sep, 56% have been in Cash. Likewise, steady low mortgage rates have expanded the buyer base so more buyers can finance their Dream Key West property.
You don't spend big Cash or take on significant debt without confidence in the overall market and your standing in it.
Conclusion
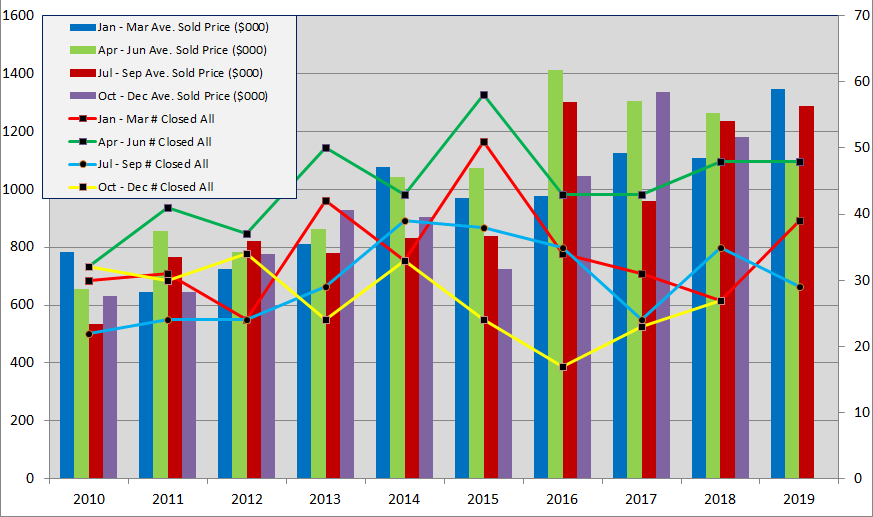
There were 39 sales in the 1st Qtr 2019, 48 sales in the 2nd Qtr and 29 sales in the 3rd Qtr. This is a typical progression leading to the 4th Qtr which historically produces 16% of the annual sales. Therefore -
If 84% of 2019's sales are completed; that is 116 sales, then the remaining 16% of annual sales will yield 22 sales in the 4th Qtr 2019 for a total number of sales for 2019 at 137-138 sales. This figure of 137-138 would match total sales in 2018 which was 137 sales. However -
Speaking with a friend contemplating listing his property for sale in Nov - Dec., I asked why he bought his property. He responded; "Because it was a good deal". I asked if he was going to list now at a "good deal" sale price. He replied, "I'm not going to give my property away".
There are 88 single family homes for sale in the Old Town area. Typical low inventory for summer. Of these 88 homes, there are zero properties for sale under $500K, two properties between $500 - $600K, two properties between $600 - $700K and eight properties between $700 - $800K.
Real estate in Key West, highly personal and pricey, is high-end retail and, for more and more buyers, is less primarily for residential and more primarily for investment purposes. When sales falter, prices reluctantly but inexorably follow. Sellers should stay closely tuned to their number of showings and feedback from potential buyers to make sure they proactively bridge the gap between "good deal" and "not giving away my property".
Final note. I received an excellent briefing from the Monroe County Tourist Development Council (TDC) at a recent Key West Chamber of Commerce meeting. This informative and well detailed briefing spotlights the economic impact of tourism in Monroe County. Please read it here.
Happy (almost) Fantasy Fest.
Good luck!