
For the 3rd month in a row, Old Town single family homes sales have been less than ten. Historically September, October and November sales have been less than ten per month though this year's total of 15 for the three months is less than the 5-year average of 27. Through November, single family home sales in Old Town trail the 5-year Jan - Nov average by 7% and Jan - Nov 2015 sales by 25%. Conversely sales prices have continued upward with average sales price per square feet up 9% versus Jan - Nov 2015 and 43% above the 5-year average.
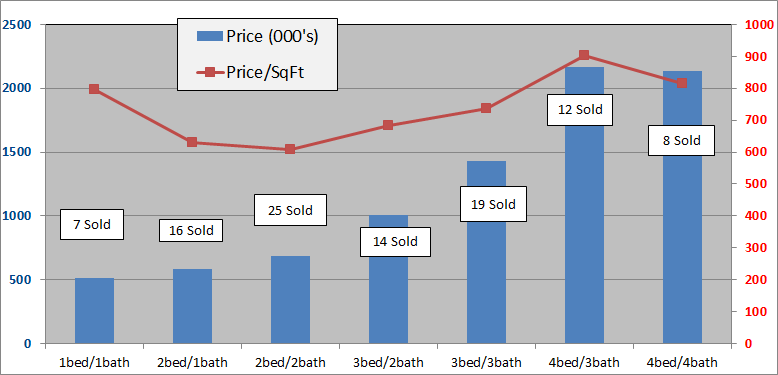
The below charts show sales of the seven most popular bed/bath combinations in Old Town Key West from January 1, 2006 to November 30, 2016.
These charts are for single family homes sold south and west of White St. and cover the neighborhoods of The Meadows, Old Town, Truman Annex and Casa Marina but not Sunset Key. You can view a neighborhood map here. The seven bed/bath combinations below contain enough sales to measure and evaluate trends after the 2004-2006 real estate Bubble.
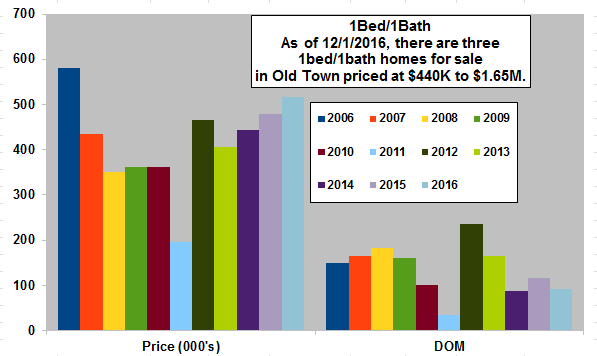
- Seven, 1Bed/1Bath homes have sold in the Old Town area thru 11/30/2016. The average Days of Market was 93 days.
- The 2016 average sale price of $516,000 is 8% above the average sale price for 2015.
- In 2015, twelve 1/1 homes sold, the most since 2001.
- The average size of the 2016 Solds is 648 sq.ft., slightly smaller than 2015; however,
- The average sale price per sqft. is $796. This figure is 12% higher than 2015 and second highest since 2006.
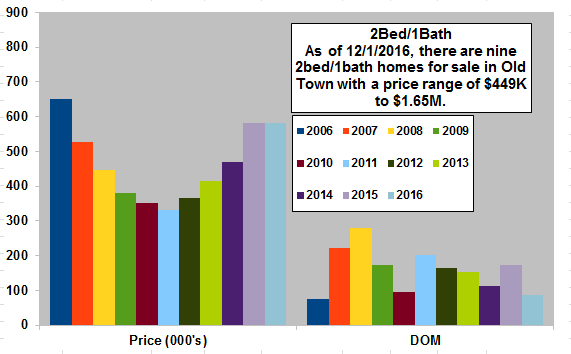
- Sixteen, 2Bed/1Bath homes have sold in the Old Town area thru 11/30/2016. The average Days on Market was 88 days.
- The average Sold price of $582,000 is the same as 2015 which was 25% more than 2014.
- Nine 2/1 homes are for sale with prices from $449K to $1.65M.
- Fifteen 2/1 homes sold in 2011, sixteen in 2012 and twenty-one in 2013 but only fourteen in 2014 so twenty-three sales for 2015 was very encouraging.
- Since 2009, 2Bed/1Bath homes have been the 3rd most popular selling home in Old Town.
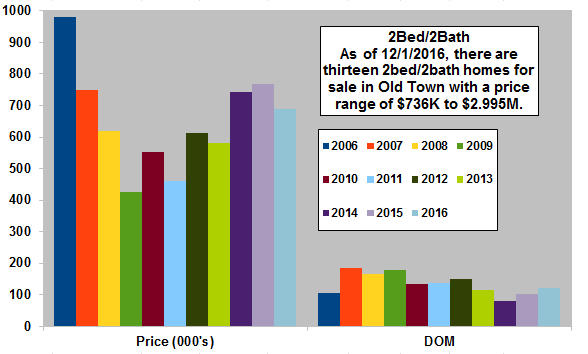
- Twenty-five, 2Bed/2Bath homes have sold in the Old Town area thru 11/30/2016. The average Days on Market was 123 Days.
- The average sold price of $688,000 is 11% below 2015 and only 62% above the low in 2009.
- T hirteen2/2's are for sale, priced between $736,000 and $2.995M.
- Average Sold price per sqft in 2016 is $606, 8% below 2015 which was 15% more than 2014.
- Since 2009, 2Bed/2Bath homes have been the biggest sellers in Old Town Key West with 232 sales.
Average sale prices of 3bed/2bath homes in Old Town are 114% above the 2009 low.
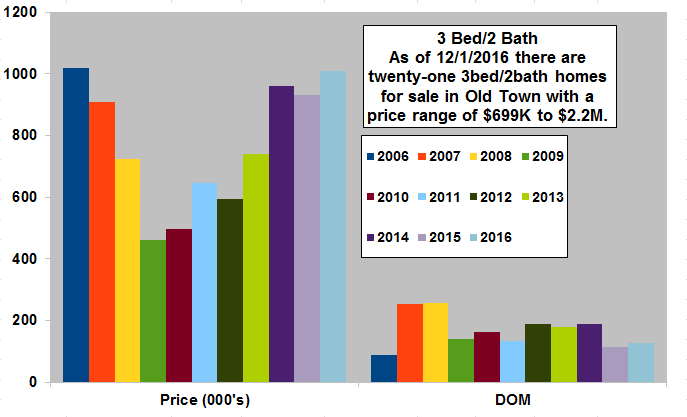
- Fourteen, 3Bed/2Bath homes have sold in the Old Town area thru 11/30/2016. The average Days on Market was 127 Days.
- The average Sold price of $1,009,000 is 14% above 2015, which was 3% below 2014, and is 114% above the 2009 low.
- Average sold price per sqft. is $683, up 10% from 2015, primarily because the thirteen homes sold are the smallest 3/2 homes sold since 2012.
- Twenty-seven 3/2's sold in 2014 and twenty-one sold in 2015.
- Since 2009, 3Bed/2Bath homes have been the 2nd biggest sellers in Old Town (152 sales) as value buyers take advantage of larger homes at low prices.
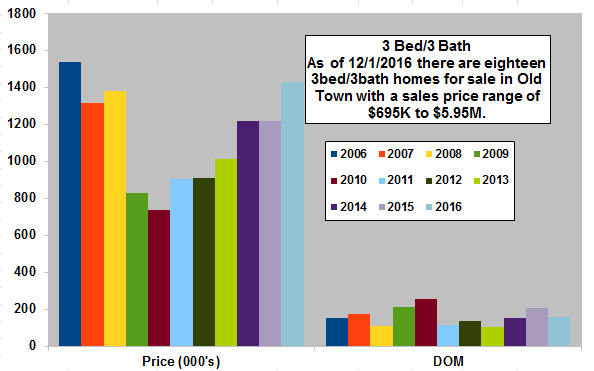
- Nineteen, 3Bed/3Bath homes have sold in the Old Town area thru 11/30/2016. The average Days on Market was 156 Days.
- The average sold price of $1.428M is 17% above 2015 and 91% above the 2010 low.
- The average size of the seventeen sold is 1863 sq.ft., slightly above average; yet, the average Sold price per sqft. of $737 is the highest since 2008.
- Twenty-three 3/3's sold in 2014 and nineteen in 2015.
- Since 2009, 3Bed/3Bath homes have been the fourth biggest seller in Old Town Key West.
Average sale prices for 4bed/3bath homes in Old Town are 156% above the 2009 low.
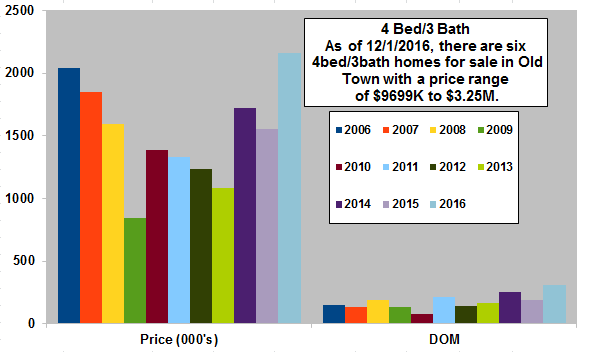
- Twelve, 4Bed/3Bath homes have sold in the Old Town area thru 11/30/2016. The average Days of Market was 309 Days.
- The 2016 average sale price of $2.163M is 39% above 2015 which was 10% below the 2014 average sold price. $2.163M is 156% above the 2009 low.
- Average Sold price per sq.ft. is $903 is the highest since 2005.
- The average size of the seven sold is 2396 sq.ft., large beautiful homes.
- This Bed/Bath configuration has finally solidified its price reversal. Plus, the twelve sales in 2012, the highest since 2008, and seven sales in 2015, with a climbing average sales price per square foot, shows strength.
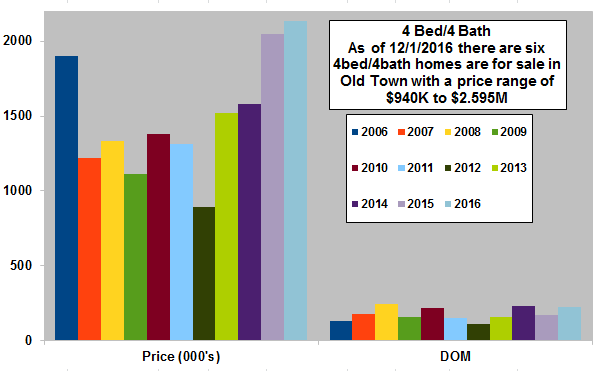
- Eight, 4Bed/4Bath homes have sold in the Old Town area thru 11/30/2016. The average Days on Market was 199 Days.
- The average Sold price of $2.132M is 4% above the 2015 average Sold price which was 30% above 2014 and is the highest recorded. The $2.132M is 92% above the 2009 low.
- The 2016 average sold price per sq.ft. of $815 is 9% above the 2015 average sold price per sqft which was 24% above 2014.Since 2003, average number of annual sales is six, with nine sold in 2013, ten in 2014 and six in 2015.
- Year to year price action is choppy as a limited number of annual sales causes large fluctuations in average sales price.
Summary
Single family home sales in Old Town have maintained a steady, albeit slightly behind 2015, trend throughout 2016. Number of sales have trailed slightly but prices have held steat to up.
Cash sales continue throughout the price range and a steady to up stock market should continue that trend. Likewise, a stable bond market should keep interest rates well within reach of other Key West buyers so nominally rising mortgages rates should not negatively impact sales.
Psychologically, hurricanes have stayed away and there are no visible external pressures that would derail the Key west market of the buyers who choose Key West as their hideaway.
If you have any questions or comments you can contact me here.
Good luck!