Five single family homes sold in the Old Town area in June bringing the half year total to 57 sales, 32% below the 5-year (2015 - 2019) average. The 2nd Qtr 2020 had 25 sales which is 48% below the 5-year average for Apr - June sales. Of note, 47% of all sales were in Cash, only a few points below the 5-year average of 51%. On Prices, the average sold price topped $1M each month Jan - June with the 2nd Qtr 2020 average sold price 9% higher than the 2nd Qtr 2019. The Jan - June 2020 average sold price per square foot of $777, while 2% below the average for Jan - June 2019, was 14% above the 5-year average sold price per sqft.
____________________________________________________________________________________
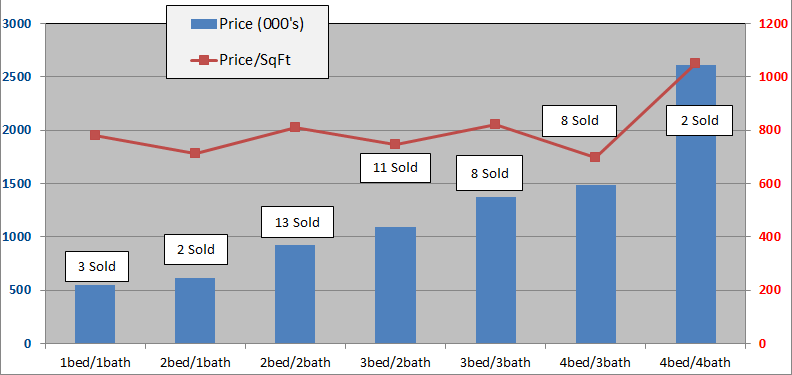
The below charts show sales of the seven most popular bed/bath combinations in Old Town Key West from January 1, 2011 to June 30, 2020. When there is a difference between total home sales and the sum of sales in the below seven charts it is because of a sale of, for instance, a 2bed/3bath or 3bed/1bath house or a house with more than four bedrooms.
These charts are for single family homes sold south and west of White St. and cover the six neighborhoods of The Meadows, Old Town North and South, Bahama Village, Truman Annex and Casa Marina but not Sunset Key. You can view a map of the six neighborhoods of Old Town here. An analysis of 1st Half 2020 sales, neighborhood by neighborhood, is here.
The seven bed/bath combinations below contain enough sales to measure and evaluate trends after the 2004-2006 real estate Bubble.
1 Bedroom/1 Bathroom
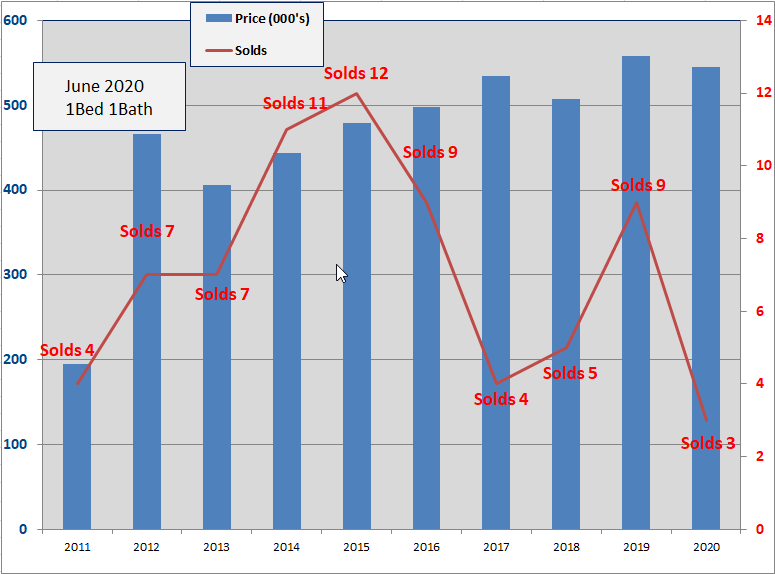
- Three, 1Bed/1Bath homes have sold in the Old Town area thru 6/30/2020. The average number of days to sell is 41 days.
- There are five 1/1 homes for sale from $549K to $799K.
- The 2020 average sale price of $545,000 is 2% less than the average sale price for 2019 and 179% above the 2011 low.
- In 2015, twelve homes sold and nine in 2016 and 2019, otherwise sales have been weak.
- The average size of the 2020 homes sold is 700 sq.ft., biggest since 2013. The average sale price per sqft. of $779 is 13% below 2019.
2 Bedroom/1 Bathroom

- Two, 2Bed/1Bath homes have sold in the Old Town area thru 6/30/2020. The average number of days to sell is 72 days.
- The 2020 average Sold price of $613,000 is 9% above 2019 which at $560K was down 29% from 2018. The $613K is 84% above the 2011 low.
- Nine 2/1 homes are for sale with prices from $539K to $1.289M.
- Twenty-five homes sold in 2018 and twenty-one in 2019.
- Since 2009, 2Bed/1Bath homes have been the 3rd most popular selling home in Old Town with 205 sales
2 Bedroom/2 Bathroom
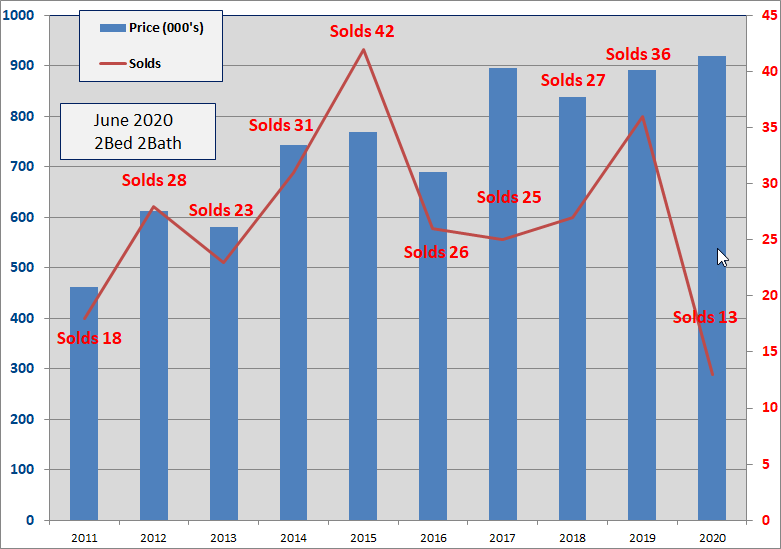
- Thirteen, 2Bed/2Bath homes have sold in the Old Town area thru 6/30/2020. The average number of Days to sell is 112 Days.
- The average sold price of $920,000 is 3% above 2019, is the highest average sold price since 2006 and is 116% above the low in 2009.
- Sixteen 2/2's are for sale, priced between $769K and $1.439M.
- The 2020 average Sold price per sqft is $810, up 12% over 2019. In 2019 the average was $724, in 2018 the average was $747.
- Since 2009, 2Bed/2Bath homes have been the biggest sellers in Old Town Key West with 334 sales.
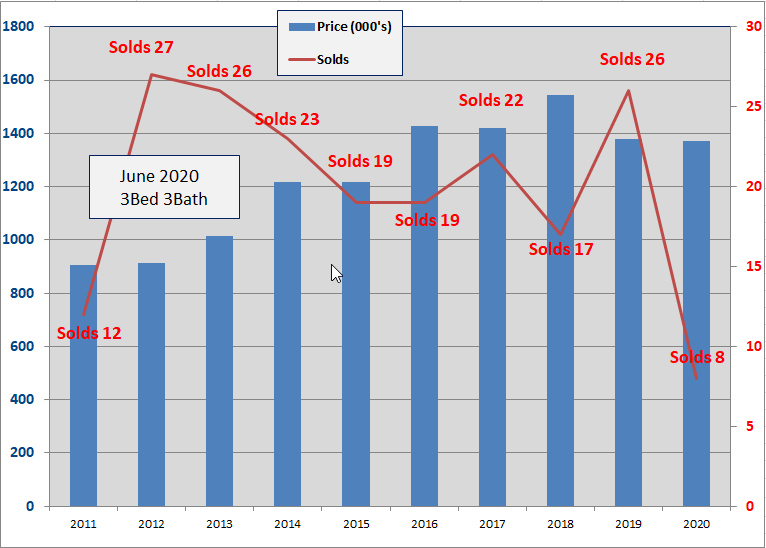
3 Bedroom/2 Bathroom
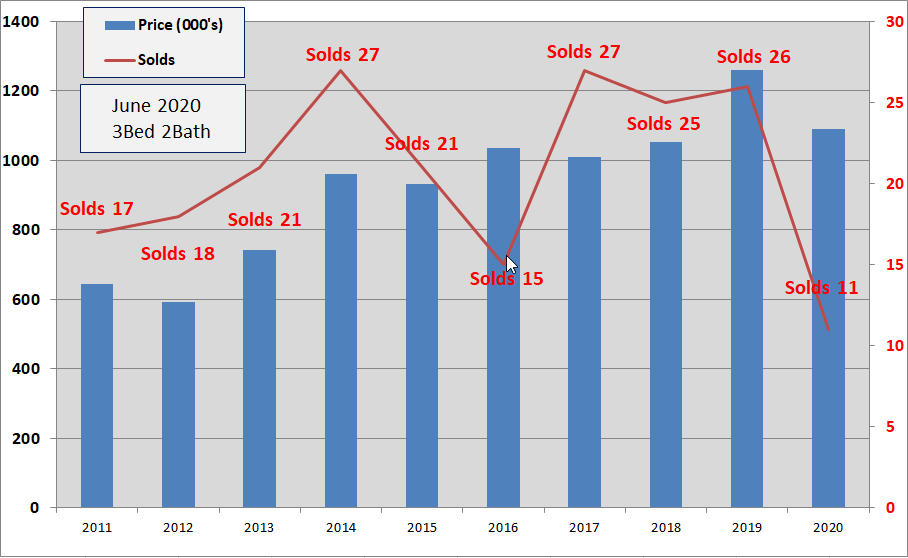
- Eleven, 3Bed/2Bath homes have sold in the Old Town area thru 6/30/2020. The average number of Days to sell is 86 Days.
- The average Sold price of $1,091,000 is down 13% from 2019 and is 137% above the 2009 low.
- The average sold price per sqft. is $746, down 4% from 2019.
- Twenty-seven homes sold in 2017, twenty-five in 2018 and twenty-six in 2019.
- Since 2009, 3Bed/2Bath homes have been the 2nd biggest sellers in Old Town with 242 sales.
3 Bedroom/3 Bathroom
- Eight, 3Bed/3Bath homes have sold in the Old Town area thru 6/30/2020. The average number of Days to sell is 44 Days.
- The 2020 average sold price of $1.372M is 1% below 2019 which was 11% below 2018. $1.372M is 86% above the 2010 low.
- The average Sold price per sqft. of $820 is up 7% over 2019 and is the 2nd highest recorded for 3/3 homes.
- Seventeen homes sold in 2018 and twenty-six in 2019.
- Since 2009, 3Bed/3Bath homes have been the fourth biggest seller in Old Town Key West
4 Bedroom/3 Bathroom
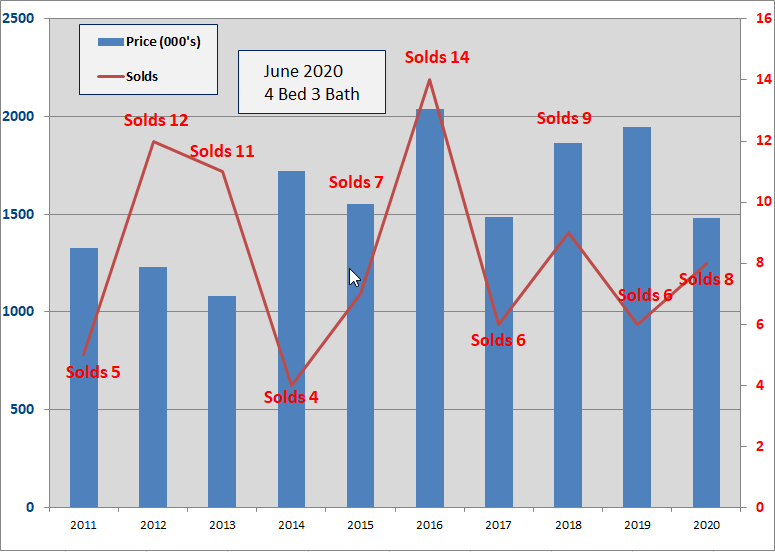
- Eight, 4bed/3bath homes have sold in the Old Town area thru 6/30/2020. The average number of days to sell is 101 days.
- The average sold price of $1.482M, is down 24% from 2019 and 75% above the 2009 low.
- More 4/3's have sold thru June than the total Sold in 4 of the last 6 years.
- The average sales price per sqft is $698, down 24% from 2019.
- There are four homes for sale, ranging in price from $1.55M to $3.35M.
- Number of sales and sales prices for 4Bed/3Bath homes is very choppy though there has been an erratic up trend in average sale price since 2013.
4 Bedroom/4 Bathroom
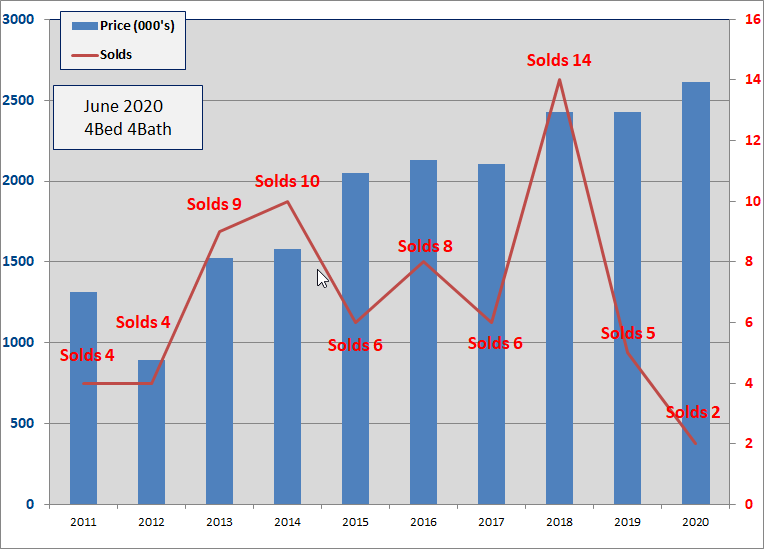
- Two, 4Bed/4Bath homes have sold in the Old Town area thru 6/30/2020. Average number of Days to sell is 28 days. Five homes sold in 2019 at an average days on market of 52 days.
- There are twelve 4/4's for sale ranging from $1.69M to $3.9M.
- The 2020 average sold price of $2.611M is up 7% over 2019, which was unchanged from 2018, and is up 27% since 2015.
- The 2020 average sold price per sq.ft. of $1049 is down 6% from 2019.
- Since 2003, average number of annual sales is six, with six in 2017, fourteen in 2018 and five in 2019. Despite the choppy number of sales, price action has been steady, $2M - $2.4M.
Summary
So tell me some good news -
- Inventory of homes For Sale is only 1 or 2 homes less than an average summer.
- 2nd Qtr average sold price up 9% over 2nd Qtr 2019
- Cash sales, at 47% of total sales, shows continued Buyer confidence in the long term resilience of the market
- Average sold price of 2/2's, at $920K, is highest since 2006
- More 4/3's have sold thru June than the total number sold in 4 of the last 6 years
- There are 16 Contingent and 4 Pending in the pipeline.
Conclusion

Buyers of Key West real estate know exactly what they are doing. Theirs is the same diligent intelligence that propels money managers of pension, mutual, ETF and endowment funds to look for opportunity and to work towards it. Hence, the all-time highs of the Nasdaq and continued strong move upward of the S&P 500 and the DOW. The Buyer pool has tightened but not their demand for a safe haven Key West home.
Buyers of Key West real estate are not having Covid parties and will not let those or other near-term headlines dissuade them from adding Key West real estate to their portfolio of long-term investments and rewards. When you read the neighborhood sales report you will see steady prices and that right priced homes are selling without delay.
If you have any comments or questions, please contact me here.
Good luck!
Additional Sources: