Ten homes sold in Old Town Key West in August, one off the 5-year (2015 - 2019) average and brings year to date solds to 82, down 24% from the 5-year Jan - August average. One hundred and nine single family homes are for sale in Old Town, six homes below a typical summer inventory. There are 12 Contingent and 6 Pending in the pipeline. On Prices, August's average sold price of $1.579M was highest for the year as five homes sold for $1.9M or higher. The average sold price per foot of $763 was highest since March and raises the year to date average to $759 per sqft, 10% above the 5-year average and 7% below end of 2019.
____________________________________________________________________________________
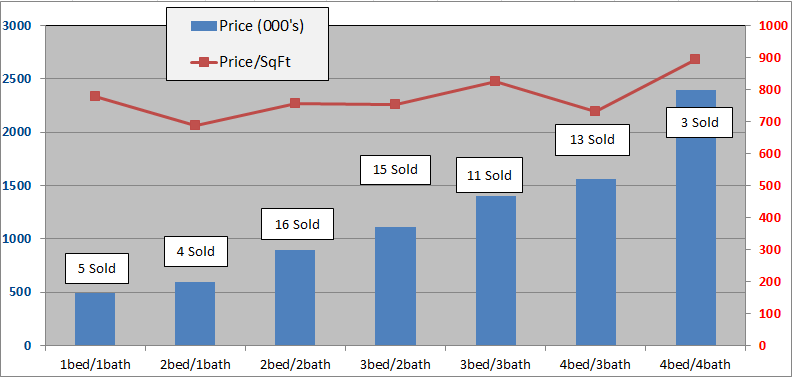
The below charts show sales of the seven most popular bed/bath combinations in Old Town Key West from January 1, 2011 to August 31, 2020. When there is a difference between total home sales and the sum of sales in the below seven charts it is because of a sale of, for instance, a 2bed/3bath or 3bed/1bath house or a house with more than four bedrooms.
These charts are for single family homes sold south and west of White St. and cover the six neighborhoods of The Meadows, Old Town North and South, Bahama Village, Truman Annex and Casa Marina but not Sunset Key. You can view a map of the six neighborhoods of Old Town here. An analysis of 1st Half 2020 sales, neighborhood by neighborhood, is here.
The seven bed/bath combinations below contain enough sales to measure and evaluate trends after the 2004-2006 real estate Bubble.
1 Bedroom/1 Bathroom
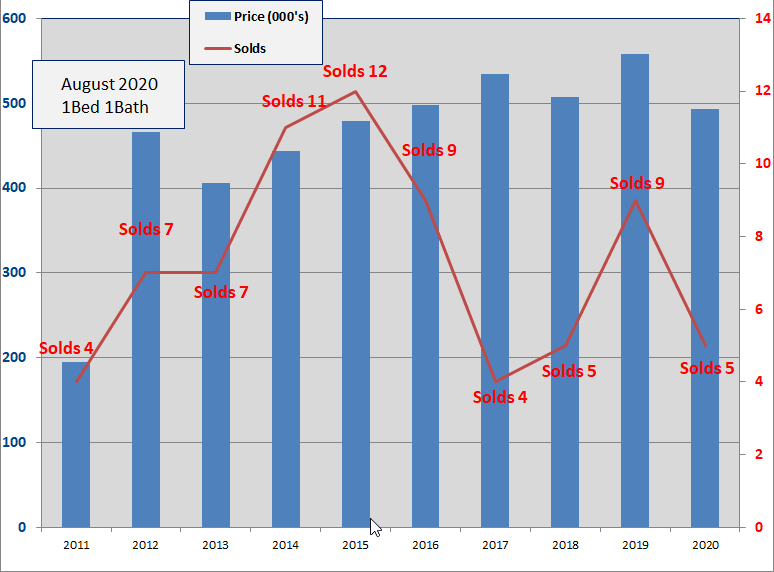
- Five, 1Bed/1Bath homes have sold in the Old Town area thru 8/31/2020. The average number of days to sell is 58 days.
- There are three 1/1 homes for sale from $608K to $799K.
- The 2020 average sale price of $493,000 is 12% less than the average sale price for 2019 and 153% above the 2011 low.
- In 2015, twelve homes sold and nine in 2016 and 2019, otherwise sales have been weak.
- The average size of the 2020 homes sold is 634 sq.ft., biggest since 2015. The average sale price per sqft. of $777 is 13% below 2019.
2 Bedroom/1 Bathroom
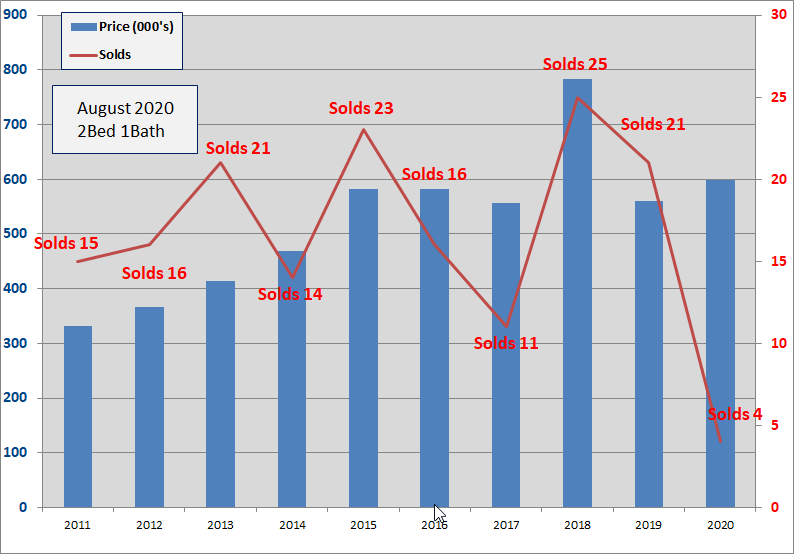
- Four, 2Bed/1Bath homes have sold in the Old Town area thru 8/31/2020. The average number of days to sell is 84 days.
- The 2020 average Sold price of $599,000 is 7% above 2019 which at $560K was down 29% from 2018. The $599K is 80% above the 2011 low.
- Six 2/1 homes are for sale with prices from $625K to $1.289M.
- Twenty-five homes sold in 2018 and twenty-one in 2019.
- Since 2009, 2Bed/1Bath homes have been the 3rd most popular selling home in Old Town with 207 sales
2 Bedroom/2 Bathroom
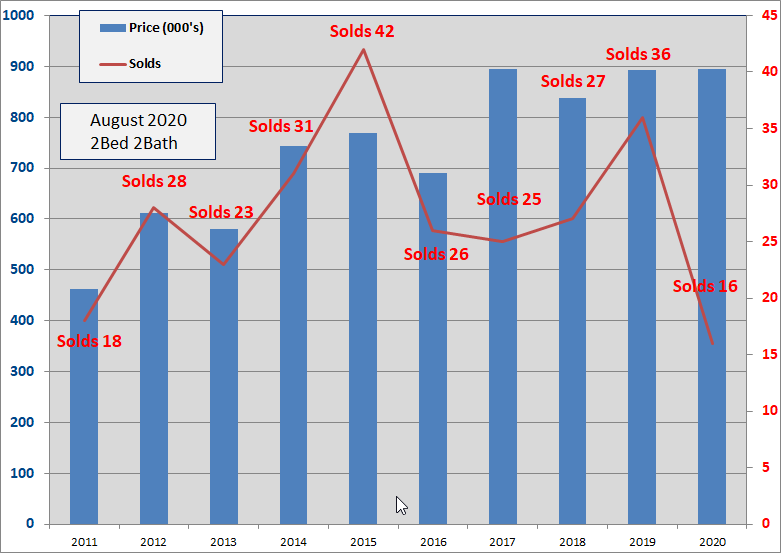
- Sixteen, 2Bed/2Bath homes have sold in the Old Town area thru 8/31/2020. The average number of Days to sell is 105 Days.
- The average sold price of $896,000 is unchanged from 2019, is the highest average sold price since 2006 and is 111% above the low in 2009.
- Fifteen 2/2's are for sale, priced between $649K and $1.439M.
- The 2020 average Sold price per sqft is $755, up 4% over 2019. In 2019 the average was $724, in 2018 the average was $747.
- Since 2009, 2Bed/2Bath homes have been the biggest sellers in Old Town Key West with 337 sales.
3 Bedroom/2 Bathroom
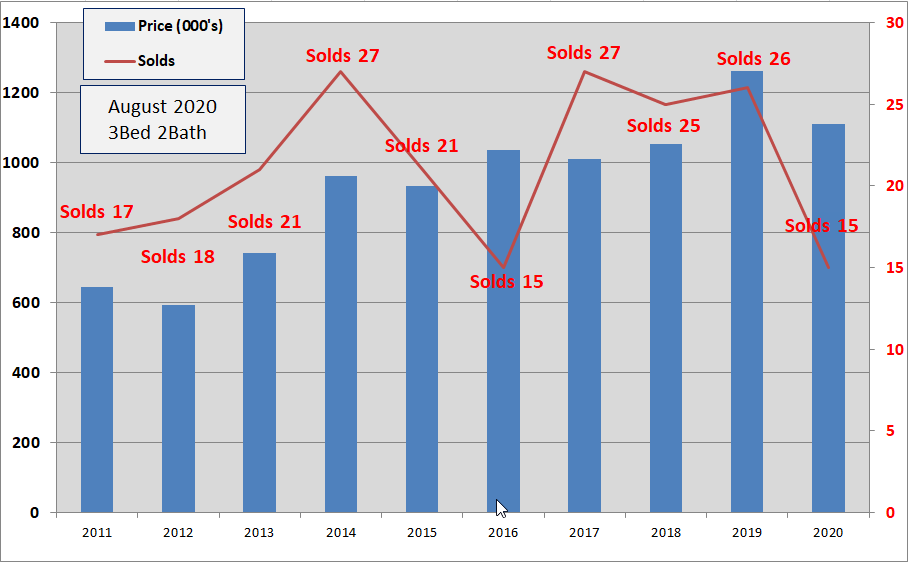
- Fifteen, 3Bed/2Bath homes have sold in the Old Town area thru 8/31/2020. The average number of Days to sell is 122 Days.
- The average Sold price of $1,110,000 is down 12% from 2019 and is 141% above the 2009 low.
- The average sold price per sqft. is $753, down 3% from 2019.
- Twenty-seven homes sold in 2017, twenty-five in 2018 and twenty-six in 2019.
- Since 2009, 3Bed/2Bath homes have been the 2nd biggest sellers in Old Town with 246 sales
3 Bedroom/3 Bathroom
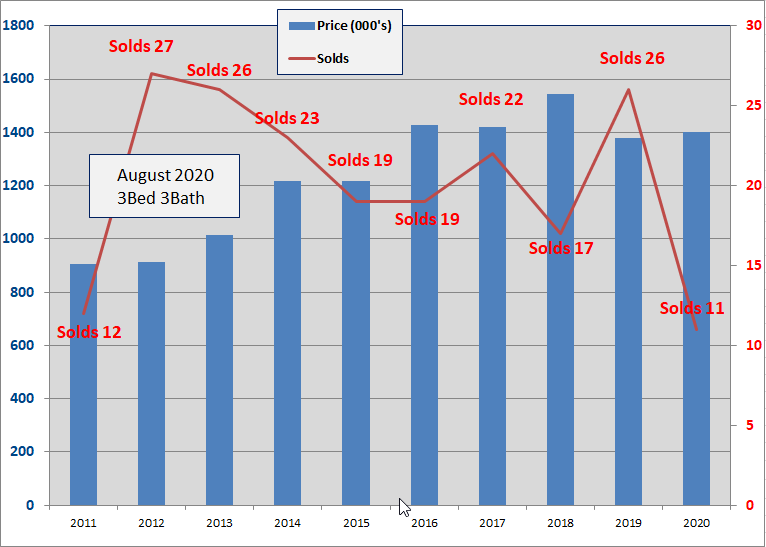
- Eleven, 3Bed/3Bath homes have sold in the Old Town area thru 8/31/2020. The average number of Days to sell is 102 Days.
- The 2020 average sold price of $1.402M is 2% above 2019 which was 11% below 2018. $1.402M is 90% above the 2010 low.
- The average Sold price per sqft. of $824 is up 8% over 2019 and is the 2nd highest recorded for 3/3 homes.
- Seventeen homes sold in 2018 and twenty-six in 2019.
- Since 2009, 3Bed/3Bath homes have been the fourth biggest seller in Old Town Key West
4 Bedroom/3 Bathroom
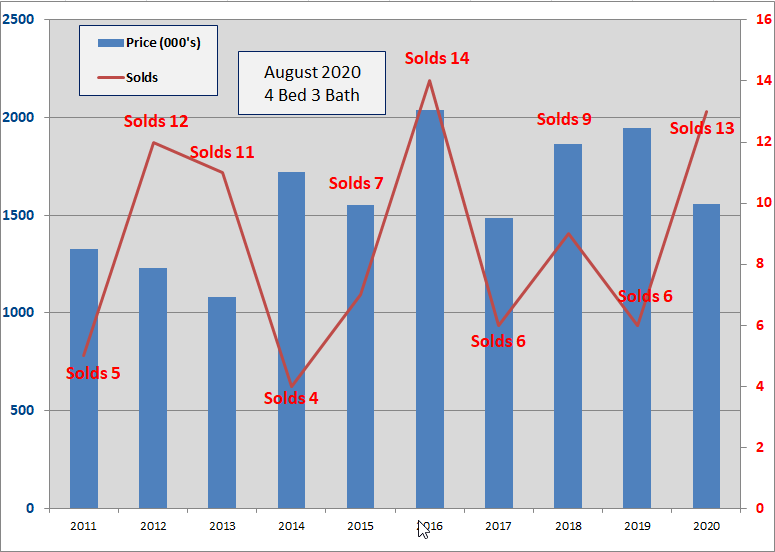
- Thirteen, 4bed/3bath homes have sold in the Old Town area thru 8/31/2020. The average number of days to sell is 98 days, 18% quicker than 2019.
- The average sold price of $1.556M, is down 20% from 2019 and is 84% above the 2009 low.
- More 4/3's have sold thru August than the total Sold in 5 of the last 6 years.
- The average sales price per sqft is $730, down 20% from 2019.
- There are seven homes for sale, ranging in price from $1.49M to $3.35M.
- Number of sales and sales prices for 4Bed/3Bath homes is very choppy though there has been an erratic up trend in average sale price since 2013.
4 Bedroom/4 Bathroom
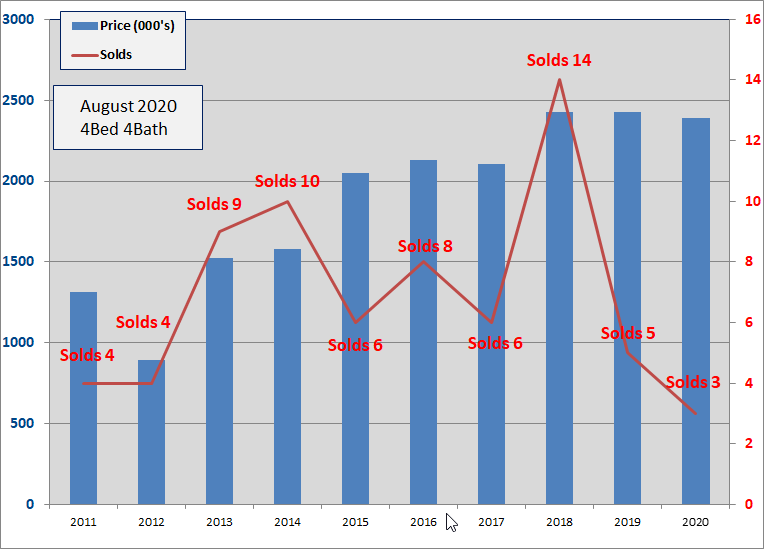
- Three, 4Bed/4Bath homes have sold in the Old Town area thru 8/31/2020. Average number of Days to sell is 37 days. Five homes sold in 2019 at an average days on market of 52 days.
- There are twelve 4/4's for sale ranging from $1.99M to $3.9M.
- The 2020 average sold price of $2.391M is down 2% from 2019, which was unchanged from 2018, and is up 115% since the 2009 low.
- The 2020 average sold price per sq.ft. of $894 is down 20% from 2019.
- Since 2003, average number of annual sales is six, with six in 2017, fourteen in 2018 and five in 2019. Despite the choppy number of sales, price action has been steady, $2M - $2.4M.
Conclusion
Here are your year to date Old Town Key West highlights:
- Inventory is a little soft but reasonable.
- Cash sales are steady at 49%
- Homes are selling quicker than in 2019 except for 2bed/2bath and 3bed/2bath.
Meanwhile people who know how to make money continue to do so:
- The Dow had its best August since 1984, Up 7.6%
- The S&P had its best August since 1986, Up 7%
- The Nasdaq had its best August since 2000, Up 9.6%
- All three of the indexes were up for the 5th month in a row.
- Manufacturing reports and indexes are up over 53% and job growth is very positive.
- Will there be a pullback headed into the election - definitely. You never lose money taking profits, especially when you convert cash into a resilient real estate market, aka Key West.
What to do? It is a Buyer's market. When buyers return full force they will quickly buy the best homes at the best prices. Seeing this, inventory will build. If you miss the return wave you might miss out completely. Price to Sell.
If you have any comments or questions, please contact me here.
Good luck!
Additional Sources: