
Thirteen homes sold in June giving the 1st half of 2018 a total of 76 sales. This compares with 74 sales mid-year 2017 and 77 sales mid-year 2016. 2017 ended with 121 sales and 2016 ended with 129 sales. Over the 2013 - 2017, 5-year period, 60% of sales happened in the first half of the year. Therefore we can estimate a 2018 total of sales at 125 +/-. Compare this with 2015 when mid year there were 109 sales and year end 171. On pricing, June's average sales price of $1.094M was the 5th month in a row over $1M and 8th Qtr of the last nine to be over $1M. Average sales price per sqft for June dropped slightly to $689 resulting in a 1st half figure of $746. 2017 ended at $726 per sqft.
_____________________________________________________________________________________
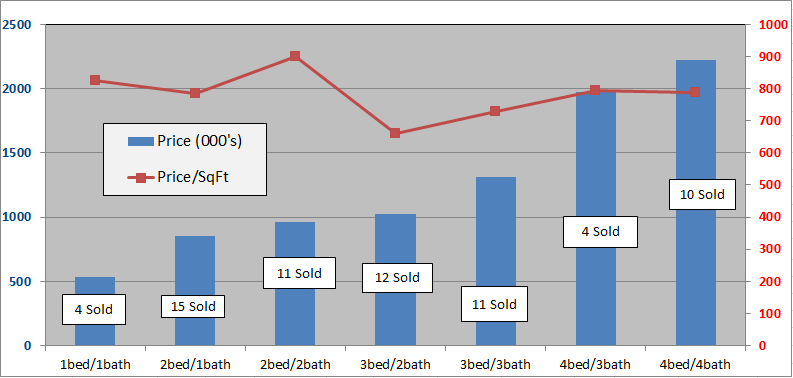
The below charts show sales of the seven most popular bed/bath combinations in Old Town Key West from January 1, 2008 to June 30, 2018. When there is a difference between total home sales and the sum of sales in the below seven charts it is because of a sale of, for instance, a 2bed/3bath or 3bed/1bath house or a house with more than four bedrooms.
These charts are for single family homes sold south and west of White St. and cover the six neighborhoods of The Meadows, Old Town North and South, Bahama Village, Truman Annex and Casa Marina but not Sunset Key. You can view a map of the six neighborhoods of Old Town here. An analysis of 2018 mid-year sales, neighborhood by neighborhood, is here.
The seven bed/bath combinations below contain enough sales to measure and evaluate trends after the 2004-2006 real estate Bubble.
1 Bedroom/1 Bathroom
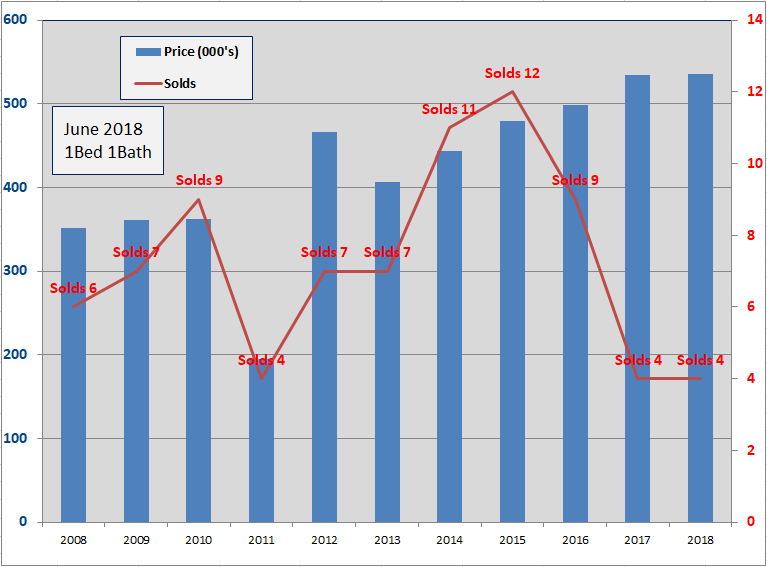
- Four, 1Bed/1Bath homes have sold in the Old Town area thru 6/30/2018. The average number of days to sell is 46 days.
- There are three1/1 homes for sale at $329K and $738K.
- The 2018 average sale price of $535,000 is identical to the average sale price for 2017.
- In 2015, twelve homes sold, the most since 2001. In 2016, 9 sold. In 2017 there were 4 sales.
- The average size of the 2018 homes sold is 649 sq.ft., slightly above average; however, the average sale price per sqft. of $825 is 4% below 2017.
2 Bedroom/1 Bathroom
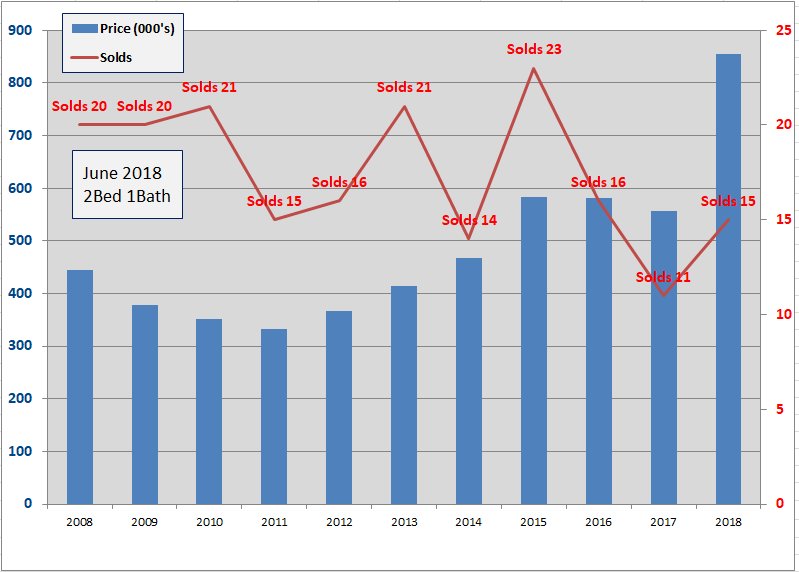
- Fifteen, 2Bed/1Bath homes have sold in the Old Town area thru 6/30/2018. The average number of days to sell is 70 days.
- The average Sold price of $855,000 is up 53% from 2017 which at $557K was down 4% from 2016. The $855K is 158% above the 2011 low.
- Nine 2/1 homes are for sale with prices from $475K to $1.25M.
- Sixteen 2/1's sold in 2016, eleven in 2017.
- Since 2009, 2Bed/1Bath homes have been the 3rd most popular selling home in Old Town with 172 sales.
2 Bedroom/2 Bathroom
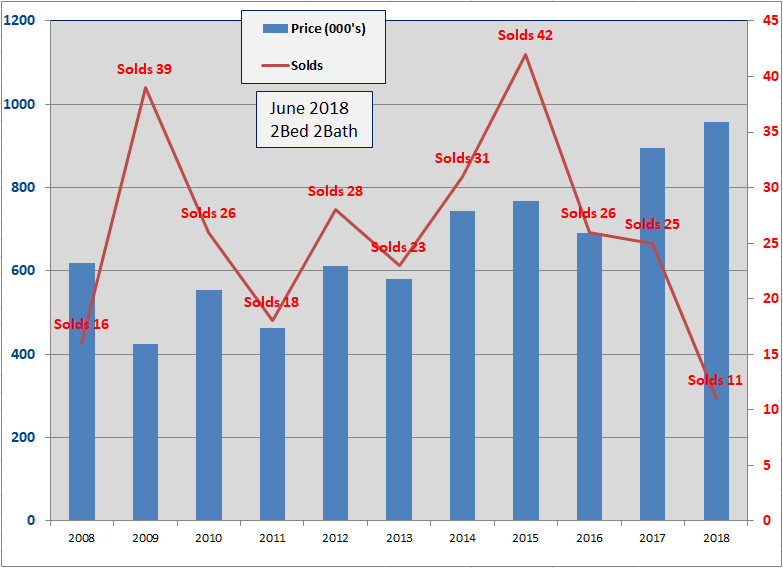
- Eleven, 2Bed/2Bath homes have sold in the Old Town area thru 6/30/2018. The number of Days to sell is 133 Days, 25% longer than 2017.
- The average sold price of $959,000 is up 7% from 2017 and is 126% above the low in 2009.
- Sixteen 2/2's are for sale, priced between $575,000 and $1.28M.
- The average Sold price per sqft for 2018 is $900. In 2017 the average was $704, in 2016 the average was $614.
- Since 2009, 2Bed/2Bath homes have been the biggest sellers in Old Town Key West with 269 sales.
3 Bedroom/2 Bathroom
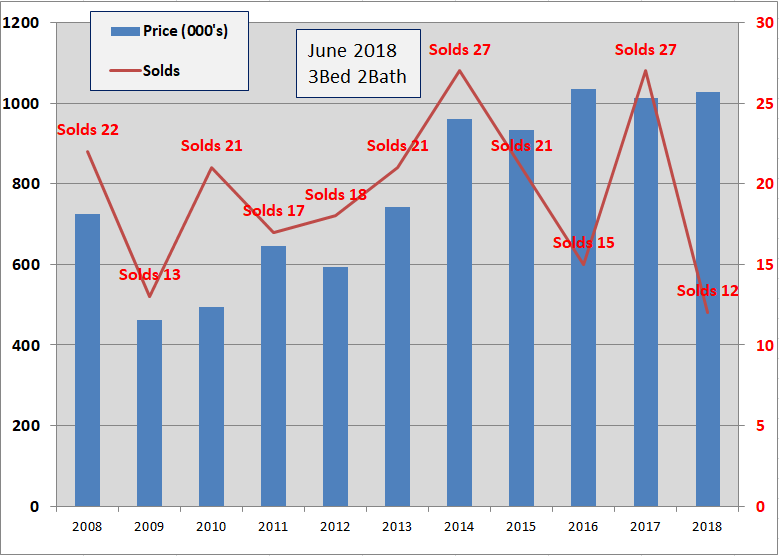
- Twelve, 3Bed/2Bath homes have sold in the Old Town area thru 6/30/2018. The number of Days to sell is 172 Days.
- The average Sold price of $1,028,000 is up 2% from 2017 which was 2% below 2016 and is 123% above the 2009 low.
- The average sold price per sqft. is $661, down 2% from 2017.
- Twenty-one 3/2's sold in 2015, fifteen in 2016 and twenty-seven in 2017.
- Since 2009, 3Bed/2Bath homes have been the 2nd biggest sellers in Old Town with 192 sales.
3 Bedroom/3 Bathroom
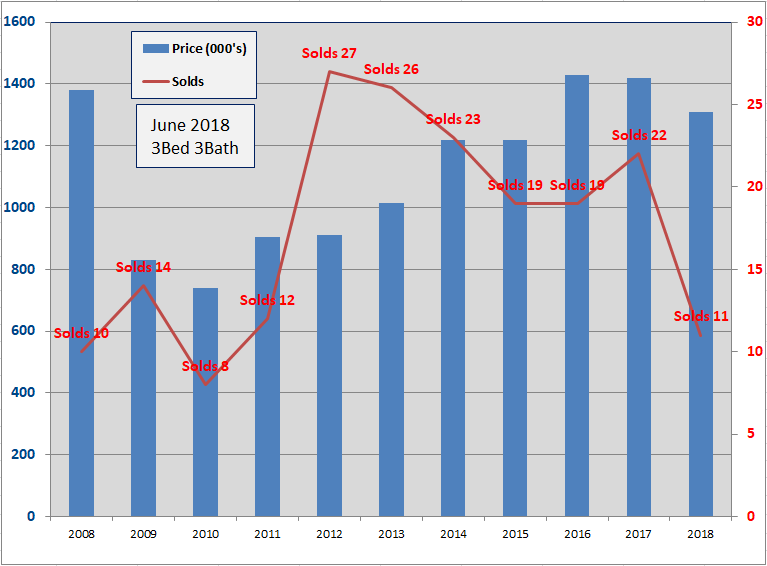
- Eleven, 3Bed/3Bath homes have sold in the Old Town area thru 6/30/2018. The average number of Days to sell is 156 Days.
- The average sold price of $1.31M is down 8% from 2017 which was 1% below 2016.
- The average Sold price per sqft. of $729 is down 10% from 2017. 2017's $806 was the highest since 2005.
- Nineteen homes sold in both 2015 and 2016 with twenty-two sales in 2017.
- Since 2009, 3Bed/3Bath homes have been the fourth biggest seller in Old Town Key West
4 Bedroom/3 Bathroom
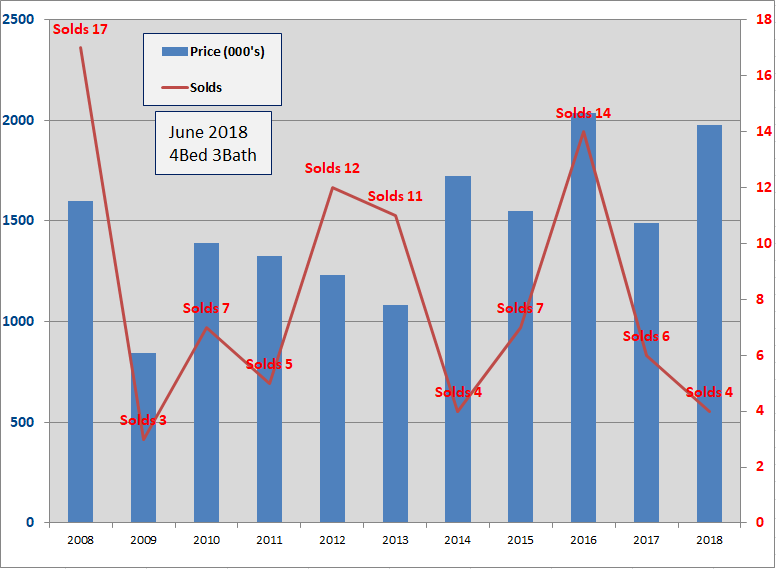
- Four, 4Bed/3Bath homes have sold in the Old Town area thru 6/30/2018. Avrage number of days to sell is 107 days. In 2017, the average number of Days to sell was 51 days.
- The average home sold price thru June is $1.974M, up 33% over 2017. In 2017 the average sale price of $1.488M was 27% below 2016 with the 5-year average sales price of $1.525M.
- There are 9 homes for sale ranging in price from $1.09M to $3.75M.
- Number of sales and sales prices for 4Bed/3Bath homes is very choppy though there has been an upward trend in average sale price since 2013.
4 Bedroom/4 Bathroom
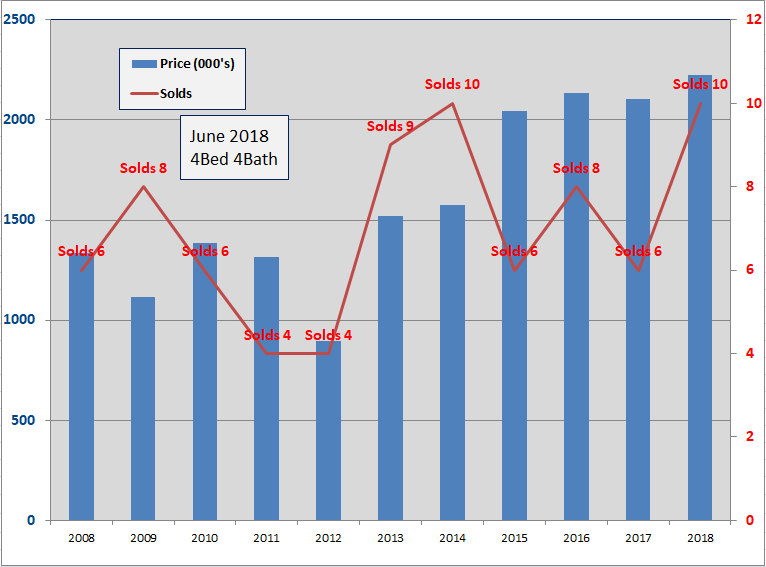
- Ten, 4Bed/4Bath homes have sold in the Old Town area thru 6/30/2018. The average number of Days to sell is 126 days. Ten sales equals the record for sales set in 2014.
- There are ten 4/4's for sale ranging from $1.2M to $6.2M.
- The 2018 average Sold price of $2.26M is up 6% from 2017 which was 1% below 2016.
- The average sold price per sq.ft. of $787 is 3% above 2017.
- Since 2003, average number of annual sales is six, with six in 2015, eight in 2016 and six in 2017.
- Year to year price action is choppy as a limited number of annual sales causes large fluctuations in average sales price.
Summary
Sales remain - flat, steady, consistent - take your pick. Average sale prices and average sale price per sqf.ft. both continue higher; albeit, price per sqft increases are flattening out at 3% to 7% year-to-year increases.
Days on Market, the number of days from Listing to Closing, is getting longer except for the smaller 1 and 2 bedroom homes. Sale price per sq.ft. for 1Bed/2Bath homes has the largest increase this year at 37% over 2017.
Of note, cash sales still dominate as 41 of the 75 sales, or 55%, were in cash. Sale prices ranged from $420K to $3.1M. This is in keeping with the 5-year trend.
Conclusion
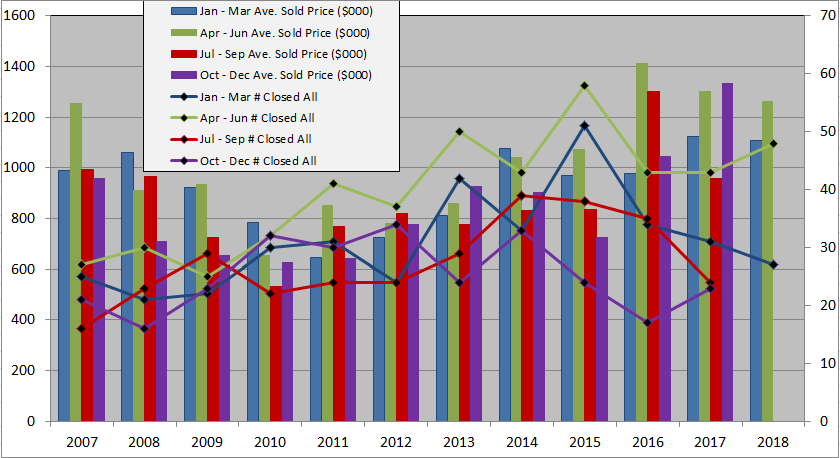
You can see that eight of the last nine quarters, going back to 2016, have had average sale prices above $1M - the vertical bars using the scale on the left side of the chart. This, even as total number of sales have stayed mostly flat - the horizontal lines using the scale on the right side of the chart.
If you have any comments or questions, please contact me here.
Good luck!